Neeson bitcoin Dynamic ATR Trailing SystemNeeson bitcoin Dynamic ATR Trailing System: A Comprehensive Guide to Volatility-Adaptive Trend Following
Introduction
The Dynamic ATR Trailing System (DATR-TS) represents a sophisticated approach to trend following that transcends conventional moving average or breakout-based methodologies. Unlike standard trend-following systems that rely on price pattern recognition or fixed parameter oscillators, this system operates on the principle of volatility-adjusted position management—a nuanced approach that dynamically adapts to changing market conditions rather than imposing rigid rules on market behavior.
Originality and Innovation
Distinct Methodological Approach
What sets DATR-TS apart from hundreds of existing trend-following systems is its dual-layered conditional execution framework. While most trend-following systems fall into one of three broad categories—moving average crossovers, channel breakouts, or momentum oscillators—this system belongs to the more specialized category of volatility-normalized trailing stop systems.
Key Original Contributions:
Volatility-Threshold Signal Filtering: Most trend systems generate signals continuously, leading to overtrading during low-volatility periods. DATR-TS implements a proprietary volatility filter that requires minimum market movement before generating signals, effectively separating high-probatility trend opportunities from market noise.
Self-Contained Position State Management: Unlike traditional systems that require external position tracking, DATR-TS maintains an internal position state that prevents contradictory signals and creates a closed-loop decision framework.
Dynamic Risk Parameter Adjustment: The system doesn't use fixed percentage stops or rigid ATR multiples. Instead, it implements a responsive adjustment mechanism that widens stops during high volatility and tightens them during low volatility, creating an optimal balance between risk protection and opportunity capture.
Trader-Centric Visualization Philosophy: Beyond mere signal generation, the system provides a comprehensive visual feedback system designed to align with human cognitive patterns, reducing emotional decision-making through consistent color coding and information hierarchy.
Technical Implementation and Functionality
Core Operational Mechanism
DATR-TS implements a volatility-adjusted trend persistence model that operates on the principle that trending markets exhibit characteristic volatility signatures. The system specifically targets medium-term directional movements (typically lasting 5-20 days) rather than short-term scalping opportunities or long-term position trades.
The Four-Pillar Architecture:
Volatility Measurement and Normalization
Calculates Average True Range (ATR) over a user-defined period
Converts absolute volatility to percentage terms relative to price
Compares current volatility against user-defined thresholds to filter suboptimal conditions
Dynamic Trailing Stop Algorithm
Establishes an initial stop distance based on current volatility
Implements a four-state adjustment mechanism that responds to price action
Maintains stop position during trend continuation while allowing for trend reversal detection
Conditional Signal Generation
Generates entry signals only when price action meets both directional and volatility criteria
Produces exit signals based on trailing stop penetration
Incorporates position state awareness to prevent conflicting signals
Comprehensive Feedback System
Provides multi-layer visual information including dynamic stop lines, signal labels, and color-coded price action
Displays real-time metrics through an integrated dashboard
Offers configurable visualization options for different trading styles
Specific Trend-Following Methodology
DATR-TS employs a volatility-normalized trailing stop breakout approach, which differs significantly from common trend identification methods:
Not a moving average crossover system (like MACD or traditional MA crosses)
Not a channel breakout system (like Bollinger Band or Donchian Channel breaks)
Not a momentum oscillator system (like RSI or Stochastic trend following)
Not a price pattern recognition system (like head-and-shoulders or triangle breaks)
Instead, it belongs to the more specialized category of volatility-adjusted stop-and-reverse systems that:
Wait for market volatility to reach actionable levels
Establish positions when price confirms directional bias through stop penetration
Manage risk dynamically based on evolving market conditions
Exit positions when the trend exhausts itself through stop violation
Practical Application and Usage
Market Environment Optimization
Ideal Conditions:
Trending markets with sustained directional movement
Medium volatility environments (neither excessively calm nor chaotic)
Timeframes: 4-hour to daily charts for optimal signal quality
Instruments: Forex majors, commodity futures, equity indices
Suboptimal Conditions:
Ranging or consolidating markets
Extreme volatility events or news-driven spikes
Very short timeframes (below 1-hour)
Illiquid or highly manipulated instruments
Parameter Configuration Strategy
Core Parameter Philosophy:
ATR Length (Default: 21 periods)
Controls the system's memory of volatility
Shorter lengths increase sensitivity but may cause overtrading
Longer lengths provide smoother signals but may lag during volatility shifts
ATR Multiplier (Default: 6.3x)
Determines the initial risk buffer
Lower values (4-5x) create tighter stops for conservative trading
Higher values (6-8x) allow for larger trends but increase drawdown risk
Volatility Threshold (Default: 1.5%)
Filters out low-quality trading environments
Adjust based on market characteristics (higher for volatile markets)
Acts as a quality control mechanism for signals
Trading Workflow and Execution
Signal Interpretation and Action:
Entry Protocol:
Wait for BLUE "BUY" signal label appearance
Confirm volatility conditions meet threshold requirements
Enter long position at market or next reasonable opportunity
Set initial stop at displayed dynamic stop level
Position Management:
Monitor dynamic stop line for position adjustment
Allow profits to run while stop protects capital
No manual adjustment required—system manages stop automatically
Exit Protocol:
Exit on ORANGE "SELL" signal label appearance
Alternative exit if price hits dynamic stop level
System will generate new entry signal if conditions warrant re-entry
Risk Management Integration:
Position sizing based on distance to dynamic stop
Volatility filter prevents trades during unfavorable conditions
Clear visual feedback on current risk exposure
Built-in protection against overtrading
Philosophical Foundation and Market Theory
Core Trading Principles
DATR-TS embodies several foundational market principles:
Volatility Defines Opportunity
Markets don't trend continuously—they alternate between trending and ranging phases
Volatility provides the energy for trends to develop and sustain
By measuring and filtering volatility, we can focus on high-probability trend phases
Risk Should Be Proportional
Fixed percentage stops ignore market context
Dynamic stops that adjust with volatility provide more appropriate risk management
Position sizing should reflect current market conditions, not arbitrary rules
Simplicity Through Sophistication
Complex systems often fail in real-world conditions
A simple core algorithm with intelligent filtering outperforms complex multi-indicator approaches
Clear visual feedback reduces cognitive load and emotional interference
Trends Persist Until Proven Otherwise
Markets exhibit momentum characteristics
Once a trend establishes itself, it tends to continue
The trailing stop methodology captures this persistence while providing exit mechanisms
Mathematical and Statistical Foundation
The system operates on several statistical market observations:
Volatility Clustering Phenomenon
High volatility periods tend to follow high volatility periods
Low volatility periods tend to follow low volatility periods
By filtering for adequate volatility, we increase the probability of capturing meaningful trends
Trend Magnitude Distribution
Most trends are small to medium in magnitude
Very large trends are rare but account for disproportionate returns
The dynamic stop methodology allows capture of varying trend magnitudes
Autocorrelation in Price Movements
Price movements exhibit short-term positive autocorrelation during trends
This persistence allows trailing stops to capture continued movement
The system leverages this characteristic without requiring explicit autocorrelation calculation
Performance Characteristics and Expectations
Typical System Behavior
Signal Frequency:
Low to moderate signal generation (prevents overtrading)
Signals concentrated during trending market phases
Extended periods without signals during ranging conditions
Risk-Reward Profile:
Win rate typically 40-60% in trending conditions
Average win larger than average loss
Risk-reward ratios of 1:2 to 1:3 achievable
Drawdown Patterns:
Controlled through volatility adjustment
Larger drawdowns during extended ranging periods
Recovery typically follows when trending conditions resume
Comparison with Alternative Approaches
Versus Moving Average Systems:
Less prone to whipsaws during ranging markets
Better adaptation to changing volatility conditions
Clearer exit signals through stop levels
Versus Channel Breakout Systems:
More responsive to emerging trends
Lower false breakout probability
Dynamic risk adjustment rather than fixed parameters
Versus Momentum Oscillator Systems:
Better trend persistence capture
Less susceptible to overbought/oversold false signals
Clearer position management rules
Educational Value and Skill Development
Learning Opportunities
DATR-TS serves as more than just a trading tool—it provides educational value through:
Market Condition Awareness
Teaches traders to distinguish between trending and ranging markets
Develops understanding of volatility's role in trading opportunities
Encourages patience and selectivity in trade execution
Risk Management Discipline
Demonstrates dynamic position sizing principles
Illustrates the importance of adaptive stops
Reinforces the concept of risk-adjusted returns
Psychological Skill Development
Reduces emotional trading through clear rules
Builds patience through conditional execution
Develops discipline through systematic approach
Customization and Evolution
The system provides a foundation for further development:
Beginner Level:
Use default parameters for initial learning
Focus on signal recognition and execution discipline
Develop understanding of system behavior across market conditions
Intermediate Level:
Adjust parameters based on specific market characteristics
Combine with complementary analysis techniques
Develop personal variations based on trading style
Advanced Level:
Integrate with portfolio management systems
Develop automated execution frameworks
Create derivative systems for specialized applications
Conclusion: The Modern Trend-Following Paradigm
The Dynamic ATR Trailing System represents a significant evolution in trend-following methodology. By moving beyond simple price pattern recognition or fixed parameter oscillators, it embraces the complex reality of financial markets where volatility, trend persistence, and risk management interact dynamically.
This system doesn't claim to predict market direction or identify tops and bottoms. Instead, it provides a systematic framework for participating in trends when they emerge, managing risk appropriately as conditions change, and preserving capital during unfavorable environments.
For traders seeking a methodology that combines mathematical rigor with practical execution, adapts to changing market conditions rather than fighting against them, and provides clear, actionable information without cognitive overload, DATR-TS offers a sophisticated yet accessible approach to modern trend following.
The true value lies not in any single signal or parameter setting, but in the comprehensive philosophy of volatility-aware, risk-adjusted, conditionally-executed trend participation that the system embodies—a philosophy that aligns with how markets actually behave rather than how we might wish them to behave.
ค้นหาในสคริปต์สำหรับ "Pattern recognition"

Echo Chamber [theUltimator5]The Echo Chamber - When history repeats, maybe you should listen.
Ever had that eerie feeling you've seen this exact price action before? The Echo Chamber doesn't just give you déjà vu—it mathematically proves it, scales it, and projects what happened next.
📖 WHAT IT DOES
The Echo Chamber is an advanced pattern recognition tool that scans your chart's history to find segments that closely match your current price action. But here's where it gets interesting: it doesn't just find similar patterns - It expands and contracts the time window to create a uniquely scaled fractal. Patterns don't always follow the same timeframe, but they do follow similar patterns.
Using a custom correlation analysis algorithm combined with flexible time-scaling, this indicator:
Finds historical price segments that mirror your current market structure
Scales and overlays them perfectly onto your current chart
Projects forward what happened AFTER that historical match
Gives you a visual "echo" from the past with a glimpse into potential futures
══════════════════════════════
HOW TO USE IT
This indicator starts off in manual mode, which means that YOU, the user, can select the point in time that you want to project from. Simply click on a point in time to set the starting value.
Once you select your point in time, the indicator will automatically plot the chosen historical chart pattern and correlation over the current chart and project the price forwards based on how the chart looked in the past. If you want to change the point in time, you can update it from the settings, or drag the point on the chart over to a new position.
You can manually select any point in time, and the chart will quickly update with the new pattern. A correlation will be shown in a table alongside the date/timestamp of the selected point in time.
You can switch to auto mode, which will automatically search out the best-fit pattern over a defined lookback range and plot the past/future projection for you without having to manually select a point in time at all. It simply finds the best fit for you.
You can change the scale factor by adjusting multiplication and division variables to find time-scaled fractal patterns.
══════════════════════════════
🎯 KEY FEATURES
Two Operating Modes:
🔧 MANUAL MODE - Select any historical point and see how it correlates with current price action in real-time. Perfect for:
• Analyzing specific past events (crashes, rallies, consolidations)
• Testing historical patterns against current conditions
• Educational analysis of market structure repetition
🤖 AUTO MODE - It automatically scans through your lookback period to find the single best-correlated historical match. Ideal for:
• Quick pattern discovery
• Systematic trading approach
• Unbiased pattern recognition
Time Warp Technology:
The time warp feature expands and compresses the correlation window to provide a custom fractal so you can analyze windows of time that don't necessarily match the current chart.
💡 *Example: Multiplier=3, Divisor=2 gives you a 1.5x time stretch—perfect for finding patterns that played out 50% slower than current price action.*
Drawing Modes:
Scale Only : Pure vertical scaling—matches price range while maintaining temporal alignment at bar 0
Rotate & Scale : Advanced geometric transformation that anchors both the start AND end points, creating a rotated fit that matches your current segment's slope and range
Visual Components:
🟠 Orange Overlay : The historical match, perfectly scaled to your current price action
🟣 Purple Projection : What happened NEXT after that historical pattern (dotted line into the future)
📦 Highlight Boxes : Shows you exactly where in history these patterns came from
📊 Live Correlation Table : Real-time correlation coefficient with color-coded strength indicator
══════════════════════════════
⚙️ PARAMETERS EXPLAINED
Correlation Window Length (20) : How many bars to match. Smaller = more precise matches but noisier. Larger = broader patterns but fewer matches.
Note: if this value is too high in auto mode, the script may time out from computational overload.
Multiplication Factor : Historical time multiplier. 2 = sample every 2nd bar from history. Higher values find slower historical patterns.
Division Factor : Historical time divisor applied after multiplication. Final sample rate = (Length × Factor) ÷ Divisor, rounded down.
Lookback Range : How far back to search for patterns. More history = better chance of finding matches but slower performance.
Note: if this value is too high in auto mode, the script may time out from computational overload.
Future Projection Length : How many bars forward to project from the historical match. Your crystal ball's focal length.
══════════════════════════════
💼 TRADING APPLICATIONS
Trend Continuation/Reversal :
If the purple projection continues the current trend, that's your historical confirmation. If it reverses, you've found a potential turning point that's happened before under similar conditions.
Support/Resistance Validation :
Does the projection respect your S/R levels? History suggests those levels matter. Does it break through? You've found historical precedent for a breakout.
Time-Based Exits :
The projection shows not just WHERE price might go, but WHEN. Use it to anticipate timing of moves.
Multi-Timeframe Analysis :
Use time compression to overlay higher timeframe patterns onto lower timeframes. See daily patterns on hourly charts, weekly on daily, etc.
Pattern Education :
In Manual Mode, study how specific historical events correlate with current conditions. Build your pattern recognition library.
══════════════════════════════
📊 CORRELATION TABLE
The table shows your correlation coefficient as a percentage:
80-100%: Extremely strong correlation—history is practically repeating
60-80%: Strong correlation—significant similarity
40-60%: Moderate correlation—some structural similarity
20-40%: Weak correlation—limited similarity
0-20%: Very weak correlation—essentially random match
-20-40%: Weak inverse correlation
-40-60%: Moderate inverse correlation
-60-80%: Strong inverse correlation
-80-100%: Extremely strong inverse correlation—history is practically inverting
**Important**: The correlation measures SHAPE similarity, not price level. An 85% correlation means the price movements follow a very similar pattern, regardless of whether prices are higher or lower.
══════════════════════════════
⚠️ IMPORTANT DISCLAIMERS
- Past performance does NOT guarantee future results (but it sure is interesting to study)
- High correlation doesn't mean causation—markets are complex adaptive systems
- Use this as ONE tool in your analytical toolkit, not a standalone trading system
- The projection is what HAPPENED after a similar pattern in the past, not a prediction
- Always use proper risk management regardless of what the Echo Chamber suggests
══════════════════════════════
🎓 PRO TIPS
1. Start with Auto Mode to find high-correlation matches, then switch to Manual Mode to study why that period was similar
2. Experiment with time warping on different timeframes—a 2x factor on a daily chart lets you see weekly patterns
3. Watch for correlation decay —if correlation drops sharply after the match, current conditions are diverging from history
4. Combine with volume —check if volume patterns also match
5. Use "Rotate & Scale" mode when the current trend angle differs from the historical match
6. Increase lookback range to 500-1000+ on daily/weekly charts for finding rare historical parallels
══════════════════════════════
🔧 TECHNICAL NOTES
- Uses Pearson correlation coefficient for pattern matching
- Implements range-based scaling to normalize different price levels
- Rotation mode uses linear interpolation for geometric transformation
- All calculations are performed on close prices
- Boxes highlight actual historical bar ranges (high/low)
- Maximum of 500 lines and 500 boxes for performance optimization

CNN Statistical Trading System [PhenLabs]📌 DESCRIPTION
An advanced pattern recognition system utilizing Convolutional Neural Network (CNN) principles to identify statistically significant market patterns and generate high-probability trading signals.
CNN Statistical Trading System transforms traditional technical analysis by applying machine learning concepts directly to price action. Through six specialized convolution kernels, it detects momentum shifts, reversal patterns, consolidation phases, and breakout setups simultaneously. The system combines these pattern detections using adaptive weighting based on market volatility and trend strength, creating a sophisticated composite score that provides both directional bias and signal confidence on a normalized -1 to +1 scale.
🚀 CONCEPTS
• Built on Convolutional Neural Network pattern recognition methodology adapted for financial markets
• Six specialized kernels detect distinct price patterns: upward/downward momentum, peak/trough formations, consolidation, and breakout setups
• Activation functions create non-linear responses with tanh-like behavior, mimicking neural network layers
• Adaptive weighting system adjusts pattern importance based on current market regime (volatility < 2% and trend strength)
• Multi-confirmation signals require CNN threshold breach (±0.65), RSI boundaries, and volume confirmation above 120% of 20-period average
🔧 FEATURES
Six-Kernel Pattern Detection:
Simultaneous analysis of upward momentum, downward momentum, peak/resistance, trough/support, consolidation, and breakout patterns using mathematically optimized convolution kernels.
Adaptive Neural Architecture:
Dynamic weight adjustment based on market volatility (ATR/Price) and trend strength (EMA differential), ensuring optimal performance across different market conditions.
Professional Visual Themes:
Four sophisticated color palettes (Professional, Ocean, Sunset, Monochrome) with cohesive design language. Default Monochrome theme provides clean, distraction-free analysis.
Confidence Band System:
Upper and lower confidence zones at 150% of threshold values (±0.975) help identify high-probability signal areas and potential exhaustion zones.
Real-Time Information Panel:
Live display of CNN score, market state with emoji indicators, net momentum, confidence percentage, and RSI confirmation with dynamic color coding based on signal strength.
Individual Feature Analysis:
Optional display of all six kernel outputs with distinct visual styles (step lines, circles, crosses, area fills) for advanced pattern component analysis.
User Guide
• Monitor CNN Score crossing above +0.65 for long signals or below -0.65 for short signals with volume confirmation
• Use confidence bands to identify optimal entry zones - signals within confidence bands carry higher probability
• Background intensity reflects signal strength - darker backgrounds indicate stronger conviction
• Enter long positions when blue circles appear above oscillator with RSI < 75 and volume > 120% average
• Enter short positions when dark circles appear below oscillator with RSI > 25 and volume confirmation
• Information panel provides real-time confidence percentage and momentum direction for position sizing decisions
• Individual feature plots allow granular analysis of specific pattern components for strategy refinement
💡Conclusion
CNN Statistical Trading System represents the evolution of technical analysis, combining institutional-grade pattern recognition with retail accessibility. The six-kernel architecture provides comprehensive market pattern coverage while adaptive weighting ensures relevance across all market conditions. Whether you’re seeking systematic entry signals or advanced pattern confirmation, this indicator delivers mathematically rigorous analysis with intuitive visual presentation.

AiTrend Pattern Matrix for kNN Forecasting (AiBitcoinTrend)The AiTrend Pattern Matrix for kNN Forecasting (AiBitcoinTrend) is a cutting-edge indicator that combines advanced mathematical modeling, AI-driven analytics, and segment-based pattern recognition to forecast price movements with precision. This tool is designed to provide traders with deep insights into market dynamics by leveraging multivariate pattern detection and sophisticated predictive algorithms.
👽 Core Features
Segment-Based Pattern Recognition
At its heart, the indicator divides price data into discrete segments, capturing key elements like candle bodies, high-low ranges, and wicks. These segments are normalized using ATR-based volatility adjustments to ensure robustness across varying market conditions.
AI-Powered k-Nearest Neighbors (kNN) Prediction
The predictive engine uses the kNN algorithm to identify the closest historical patterns in a multivariate dictionary. By calculating the distance between current and historical segments, the algorithm determines the most likely outcomes, weighting predictions based on either proximity (distance) or averages.
Dynamic Dictionary of Historical Patterns
The indicator maintains a rolling dictionary of historical patterns, storing multivariate data for:
Candle body ranges, High-low ranges, Wick highs and lows.
This dynamic approach ensures the model adapts continuously to evolving market conditions.
Volatility-Normalized Forecasting
Using ATR bands, the indicator normalizes patterns, reducing noise and enhancing the reliability of predictions in high-volatility environments.
AI-Driven Trend Detection
The indicator not only predicts price levels but also identifies market regimes by comparing current conditions to historically significant highs, lows, and midpoints. This allows for clear visualizations of trend shifts and momentum changes.
👽 Deep Dive into the Core Mathematics
👾 Segment-Based Multivariate Pattern Analysis
The indicator analyzes price data by dividing each bar into distinct segments, isolating key components such as:
Body Ranges: Differences between the open and close prices.
High-Low Ranges: Capturing the full volatility of a bar.
Wick Extremes: Quantifying deviations beyond the body, both above and below.
Each segment contributes uniquely to the predictive model, ensuring a rich, multidimensional understanding of price action. These segments are stored in a rolling dictionary of patterns, enabling the indicator to reference historical behavior dynamically.
👾 Volatility Normalization Using ATR
To ensure robustness across varying market conditions, the indicator normalizes patterns using Average True Range (ATR). This process scales each component to account for the prevailing market volatility, allowing the algorithm to compare patterns on a level playing field regardless of differing price scales or fluctuations.
👾 k-Nearest Neighbors (kNN) Algorithm
The AI core employs the kNN algorithm, a machine-learning technique that evaluates the similarity between the current pattern and a library of historical patterns.
Euclidean Distance Calculation:
The indicator computes the multivariate distance across four distinct dimensions: body range, high-low range, wick low, and wick high. This ensures a comprehensive and precise comparison between patterns.
Weighting Schemes: The contribution of each pattern to the forecast is either weighted by its proximity (distance) or averaged, based on user settings.
👾 Prediction Horizon and Refinement
The indicator forecasts future price movements (Y_hat) by predicting logarithmic changes in the price and projecting them forward using exponential scaling. This forecast is smoothed using a user-defined EMA filter to reduce noise and enhance actionable clarity.
👽 AI-Driven Pattern Recognition
Dynamic Dictionary of Patterns: The indicator maintains a rolling dictionary of N multivariate patterns, continuously updated to reflect the latest market data. This ensures it adapts seamlessly to changing market conditions.
Nearest Neighbor Matching: At each bar, the algorithm identifies the most similar historical pattern. The prediction is based on the aggregated outcomes of the closest neighbors, providing confidence levels and directional bias.
Multivariate Synthesis: By combining multiple dimensions of price action into a unified prediction, the indicator achieves a level of depth and accuracy unattainable by single-variable models.
Visual Outputs
Forecast Line (Y_hat_line):
A smoothed projection of the expected price trend, based on the weighted contribution of similar historical patterns.
Trend Regime Bands:
Dynamic high, low, and midlines highlight the current market regime, providing actionable insights into momentum and range.
Historical Pattern Matching:
The nearest historical pattern is displayed, allowing traders to visualize similarities
👽 Applications
Trend Identification:
Detect and follow emerging trends early using dynamic trend regime analysis.
Reversal Signals:
Anticipate market reversals with high-confidence predictions based on historically similar scenarios.
Range and Momentum Trading:
Leverage multivariate analysis to understand price ranges and momentum, making it suitable for both breakout and mean-reversion strategies.
Disclaimer: This information is for entertainment purposes only and does not constitute financial advice. Please consult with a qualified financial advisor before making any investment decisions.

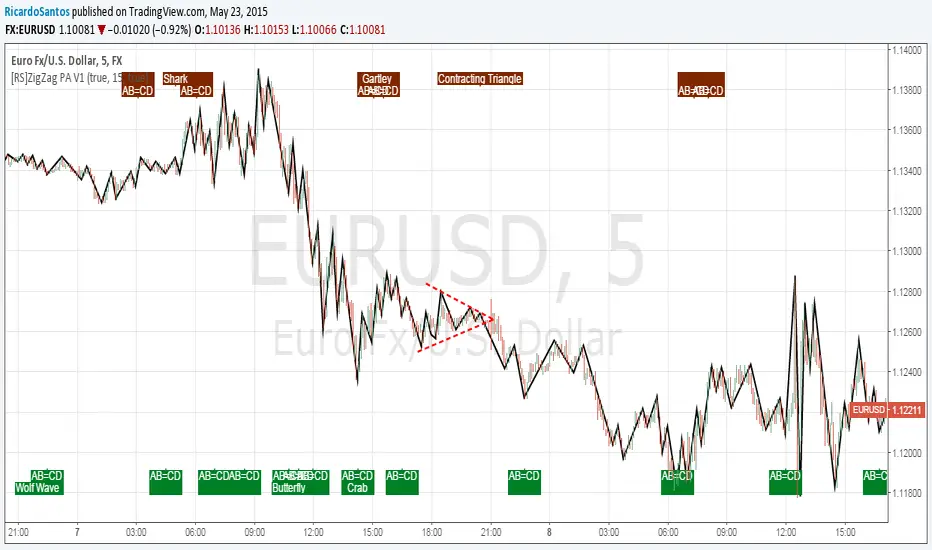
[RS]ZigZag PA V1ZigZag Based on price oscilation.
added pattern recognition, also added recognition of head and shoulders and contracting/expanding triangles to previous list of patterns :p
Use Alt Timeframe: enables optional timeframes, use higher timeframes to reduce noise.
Timeframe: said Alt Timeframe.
Show Patterns: toggles Pattern Recognition on.
Warrior Trading Momentum Strategy
# 🚀 Warrior Trading Momentum Strategy - Day Trading Excellence
## Strategy Overview
This comprehensive Pine Script strategy replicates the proven methodologies taught by Ross Cameron and the Warrior Trading community. Designed for active day traders, it identifies high-probability momentum setups with strict risk management protocols.
## 📈 Core Trading Setups
### 1. Gap and Go Trading
- **Primary Focus**: Stocks gapping up 2%+ with volume confirmation
- **Entry Logic**: Breakout above gap open with momentum validation
- **Volume Filter**: 2x average volume requirement for quality setups
### 2. ABCD Pattern Recognition
- **Pattern Detection**: Automated identification of classic ABCD reversal patterns
- **Validation**: A-B and C-D move relationship analysis
- **Entry Trigger**: D-point breakout with volume confirmation
### 3. VWAP Momentum Plays
- **Strategy**: Entries near VWAP with bounce confirmation
- **Distance Filter**: Configurable percentage distance for optimal entries
- **Direction Bias**: Above VWAP bullish momentum validation
### 4. Red to Green Reversals
- **Setup**: Reversal patterns after consecutive red candles
- **Confirmation**: Volume spike with bullish close required
- **Momentum**: Trend change validation with RSI support
### 5. Breakout Momentum
- **Logic**: Breakouts above recent highs with volume
- **Filters**: EMA20 and RSI confirmation for quality
- **Trend**: Established momentum direction validation
## ⚡ Key Features
### Smart Risk Management
- **Position Sizing**: Automatic calculation based on account risk percentage
- **Stop Loss**: 2 ATR-based stops for volatility adjustment
- **Take Profit**: Configurable risk-reward ratios (default 1:2)
- **Trailing Stops**: Profit protection with adjustable triggers
### Advanced Filtering System
- **Time Filters**: Market hours trading with lunch hour avoidance
- **Volume Confirmation**: Multi-timeframe volume analysis
- **Momentum Indicators**: RSI and moving average trend validation
- **Quality Control**: Multiple confirmation layers for signal accuracy
### PDT-Friendly Design
- **Trade Limiting**: Built-in daily trade counter for accounts under $25K
- **Selective Trading**: Priority scoring system for A+ setups only
- **Quality over Quantity**: Maximum 2-3 high-probability trades per day
## 🎯 Optimal Usage
### Best Timeframes
- **Primary**: 5-minute charts for entry timing
- **Secondary**: 1-minute for precise execution
- **Context**: Daily charts for gap analysis
### Ideal Market Conditions
- **Volatility**: High-volume, momentum-driven markets
- **Stocks**: Market cap $100M+, average volume 1M+ shares
- **Sectors**: Technology, biotech, growth stocks with news catalysts
### Account Requirements
- **Minimum**: $500+ for proper position sizing
- **Recommended**: $25K+ for unlimited day trading
- **Risk Tolerance**: Active day trading experience preferred
## 📊 Performance Optimization
### Entry Criteria (All Must Align)
1. ✅ Time filter (market hours, avoid lunch)
2. ✅ Volume spike (2x+ average volume)
3. ✅ Momentum confirmation (RSI 50-80)
4. ✅ Trend alignment (above EMA20)
5. ✅ Pattern completion (setup-specific)
### Risk Parameters
- **Maximum Risk**: 1-2% per trade
- **Position Size**: 25% of account maximum
- **Stop Loss**: 2 ATR below entry
- **Take Profit**: 2:1 risk-reward minimum
## 🔧 Customization Options
### Gap Trading Settings
- Minimum gap percentage threshold
- Volume multiplier requirements
- Gap validation criteria
### Pattern Recognition
- ABCD ratio parameters
- Swing point sensitivity
- Pattern completion filters
### Risk Management
- Risk-reward ratio adjustment
- Maximum daily trade limits
- Trailing stop trigger levels
### Time and Session Filters
- Trading session customization
- Lunch hour avoidance toggle
- Market condition filters
## ⚠️ Important Disclaimers
### Risk Warning
- **High Risk**: Day trading involves substantial risk of loss
- **Capital Requirements**: Only trade with risk capital
- **Experience**: Strategy requires active monitoring and experience
- **Market Conditions**: Performance varies with market volatility
### PDT Considerations
- **Day Trading Rules**: Accounts under $25K limited to 3 day trades per 5 days
- **Compliance**: Strategy includes trade counting for PDT compliance
- **Alternative**: Consider swing trading modifications for smaller accounts
### Backtesting vs Live Trading
- **Slippage**: Real trading involves execution delays and slippage
- **Commissions**: Factor in broker fees for accurate performance
- **Market Impact**: Large positions may affect fill prices
- **Psychological Factors**: Live trading involves emotional challenges
## 📚 Educational Value
This strategy serves as an excellent learning tool for understanding:
- Professional day trading methodologies
- Risk management principles
- Pattern recognition techniques
- Volume and momentum analysis
- Multi-timeframe analysis
## 🤝 Community and Support
Based on proven Warrior Trading methodologies with active community support. Strategy includes comprehensive plotting and information tables for educational purposes and trade analysis.
---
**Disclaimer**: This strategy is for educational purposes. Past performance does not guarantee future results. Always practice proper risk management and never risk more than you can afford to lose.
**Tags**: #DayTrading #Momentum #WarriorTrading #GapAndGo #ABCD #VWAP #PatternTrading #RiskManagement

Tensor Market Analysis Engine (TMAE)# Tensor Market Analysis Engine (TMAE)
## Advanced Multi-Dimensional Mathematical Analysis System
*Where Quantum Mathematics Meets Market Structure*
---
## 🎓 THEORETICAL FOUNDATION
The Tensor Market Analysis Engine represents a revolutionary synthesis of three cutting-edge mathematical frameworks that have never before been combined for comprehensive market analysis. This indicator transcends traditional technical analysis by implementing advanced mathematical concepts from quantum mechanics, information theory, and fractal geometry.
### 🌊 Multi-Dimensional Volatility with Jump Detection
**Hawkes Process Implementation:**
The TMAE employs a sophisticated Hawkes process approximation for detecting self-exciting market jumps. Unlike traditional volatility measures that treat price movements as independent events, the Hawkes process recognizes that market shocks cluster and exhibit memory effects.
**Mathematical Foundation:**
```
Intensity λ(t) = μ + Σ α(t - Tᵢ)
```
Where market jumps at times Tᵢ increase the probability of future jumps through the decay function α, controlled by the Hawkes Decay parameter (0.5-0.99).
**Mahalanobis Distance Calculation:**
The engine calculates volatility jumps using multi-dimensional Mahalanobis distance across up to 5 volatility dimensions:
- **Dimension 1:** Price volatility (standard deviation of returns)
- **Dimension 2:** Volume volatility (normalized volume fluctuations)
- **Dimension 3:** Range volatility (high-low spread variations)
- **Dimension 4:** Correlation volatility (price-volume relationship changes)
- **Dimension 5:** Microstructure volatility (intrabar positioning analysis)
This creates a volatility state vector that captures market behavior impossible to detect with traditional single-dimensional approaches.
### 📐 Hurst Exponent Regime Detection
**Fractal Market Hypothesis Integration:**
The TMAE implements advanced Rescaled Range (R/S) analysis to calculate the Hurst exponent in real-time, providing dynamic regime classification:
- **H > 0.6:** Trending (persistent) markets - momentum strategies optimal
- **H < 0.4:** Mean-reverting (anti-persistent) markets - contrarian strategies optimal
- **H ≈ 0.5:** Random walk markets - breakout strategies preferred
**Adaptive R/S Analysis:**
Unlike static implementations, the TMAE uses adaptive windowing that adjusts to market conditions:
```
H = log(R/S) / log(n)
```
Where R is the range of cumulative deviations and S is the standard deviation over period n.
**Dynamic Regime Classification:**
The system employs hysteresis to prevent regime flipping, requiring sustained Hurst values before regime changes are confirmed. This prevents false signals during transitional periods.
### 🔄 Transfer Entropy Analysis
**Information Flow Quantification:**
Transfer entropy measures the directional flow of information between price and volume, revealing lead-lag relationships that indicate future price movements:
```
TE(X→Y) = Σ p(yₜ₊₁, yₜ, xₜ) log
```
**Causality Detection:**
- **Volume → Price:** Indicates accumulation/distribution phases
- **Price → Volume:** Suggests retail participation or momentum chasing
- **Balanced Flow:** Market equilibrium or transition periods
The system analyzes multiple lag periods (2-20 bars) to capture both immediate and structural information flows.
---
## 🔧 COMPREHENSIVE INPUT SYSTEM
### Core Parameters Group
**Primary Analysis Window (10-100, Default: 50)**
The fundamental lookback period affecting all calculations. Optimization by timeframe:
- **1-5 minute charts:** 20-30 (rapid adaptation to micro-movements)
- **15 minute-1 hour:** 30-50 (balanced responsiveness and stability)
- **4 hour-daily:** 50-100 (smooth signals, reduced noise)
- **Asset-specific:** Cryptocurrency 20-35, Stocks 35-50, Forex 40-60
**Signal Sensitivity (0.1-2.0, Default: 0.7)**
Master control affecting all threshold calculations:
- **Conservative (0.3-0.6):** High-quality signals only, fewer false positives
- **Balanced (0.7-1.0):** Optimal risk-reward ratio for most trading styles
- **Aggressive (1.1-2.0):** Maximum signal frequency, requires careful filtering
**Signal Generation Mode:**
- **Aggressive:** Any component signals (highest frequency)
- **Confluence:** 2+ components agree (balanced approach)
- **Conservative:** All 3 components align (highest quality)
### Volatility Jump Detection Group
**Volatility Dimensions (2-5, Default: 3)**
Determines the mathematical space complexity:
- **2D:** Price + Volume volatility (suitable for clean markets)
- **3D:** + Range volatility (optimal for most conditions)
- **4D:** + Correlation volatility (advanced multi-asset analysis)
- **5D:** + Microstructure volatility (maximum sensitivity)
**Jump Detection Threshold (1.5-4.0σ, Default: 3.0σ)**
Standard deviations required for volatility jump classification:
- **Cryptocurrency:** 2.0-2.5σ (naturally volatile)
- **Stock Indices:** 2.5-3.0σ (moderate volatility)
- **Forex Major Pairs:** 3.0-3.5σ (typically stable)
- **Commodities:** 2.0-3.0σ (varies by commodity)
**Jump Clustering Decay (0.5-0.99, Default: 0.85)**
Hawkes process memory parameter:
- **0.5-0.7:** Fast decay (jumps treated as independent)
- **0.8-0.9:** Moderate clustering (realistic market behavior)
- **0.95-0.99:** Strong clustering (crisis/event-driven markets)
### Hurst Exponent Analysis Group
**Calculation Method Options:**
- **Classic R/S:** Original Rescaled Range (fast, simple)
- **Adaptive R/S:** Dynamic windowing (recommended for trading)
- **DFA:** Detrended Fluctuation Analysis (best for noisy data)
**Trending Threshold (0.55-0.8, Default: 0.60)**
Hurst value defining persistent market behavior:
- **0.55-0.60:** Weak trend persistence
- **0.65-0.70:** Clear trending behavior
- **0.75-0.80:** Strong momentum regimes
**Mean Reversion Threshold (0.2-0.45, Default: 0.40)**
Hurst value defining anti-persistent behavior:
- **0.35-0.45:** Weak mean reversion
- **0.25-0.35:** Clear ranging behavior
- **0.15-0.25:** Strong reversion tendency
### Transfer Entropy Parameters Group
**Information Flow Analysis:**
- **Price-Volume:** Classic flow analysis for accumulation/distribution
- **Price-Volatility:** Risk flow analysis for sentiment shifts
- **Multi-Timeframe:** Cross-timeframe causality detection
**Maximum Lag (2-20, Default: 5)**
Causality detection window:
- **2-5 bars:** Immediate causality (scalping)
- **5-10 bars:** Short-term flow (day trading)
- **10-20 bars:** Structural flow (swing trading)
**Significance Threshold (0.05-0.3, Default: 0.15)**
Minimum entropy for signal generation:
- **0.05-0.10:** Detect subtle information flows
- **0.10-0.20:** Clear causality only
- **0.20-0.30:** Very strong flows only
---
## 🎨 ADVANCED VISUAL SYSTEM
### Tensor Volatility Field Visualization
**Five-Layer Resonance Bands:**
The tensor field creates dynamic support/resistance zones that expand and contract based on mathematical field strength:
- **Core Layer (Purple):** Primary tensor field with highest intensity
- **Layer 2 (Neutral):** Secondary mathematical resonance
- **Layer 3 (Info Blue):** Tertiary harmonic frequencies
- **Layer 4 (Warning Gold):** Outer field boundaries
- **Layer 5 (Success Green):** Maximum field extension
**Field Strength Calculation:**
```
Field Strength = min(3.0, Mahalanobis Distance × Tensor Intensity)
```
The field amplitude adjusts to ATR and mathematical distance, creating dynamic zones that respond to market volatility.
**Radiation Line Network:**
During active tensor states, the system projects directional radiation lines showing field energy distribution:
- **8 Directional Rays:** Complete angular coverage
- **Tapering Segments:** Progressive transparency for natural visual flow
- **Pulse Effects:** Enhanced visualization during volatility jumps
### Dimensional Portal System
**Portal Mathematics:**
Dimensional portals visualize regime transitions using category theory principles:
- **Green Portals (◉):** Trending regime detection (appear below price for support)
- **Red Portals (◎):** Mean-reverting regime (appear above price for resistance)
- **Yellow Portals (○):** Random walk regime (neutral positioning)
**Tensor Trail Effects:**
Each portal generates 8 trailing particles showing mathematical momentum:
- **Large Particles (●):** Strong mathematical signal
- **Medium Particles (◦):** Moderate signal strength
- **Small Particles (·):** Weak signal continuation
- **Micro Particles (˙):** Signal dissipation
### Information Flow Streams
**Particle Stream Visualization:**
Transfer entropy creates flowing particle streams indicating information direction:
- **Upward Streams:** Volume leading price (accumulation phases)
- **Downward Streams:** Price leading volume (distribution phases)
- **Stream Density:** Proportional to information flow strength
**15-Particle Evolution:**
Each stream contains 15 particles with progressive sizing and transparency, creating natural flow visualization that makes information transfer immediately apparent.
### Fractal Matrix Grid System
**Multi-Timeframe Fractal Levels:**
The system calculates and displays fractal highs/lows across five Fibonacci periods:
- **8-Period:** Short-term fractal structure
- **13-Period:** Intermediate-term patterns
- **21-Period:** Primary swing levels
- **34-Period:** Major structural levels
- **55-Period:** Long-term fractal boundaries
**Triple-Layer Visualization:**
Each fractal level uses three-layer rendering:
- **Shadow Layer:** Widest, darkest foundation (width 5)
- **Glow Layer:** Medium white core line (width 3)
- **Tensor Layer:** Dotted mathematical overlay (width 1)
**Intelligent Labeling System:**
Smart spacing prevents label overlap using ATR-based minimum distances. Labels include:
- **Fractal Period:** Time-based identification
- **Topological Class:** Mathematical complexity rating (0, I, II, III)
- **Price Level:** Exact fractal price
- **Mahalanobis Distance:** Current mathematical field strength
- **Hurst Exponent:** Current regime classification
- **Anomaly Indicators:** Visual strength representations (○ ◐ ● ⚡)
### Wick Pressure Analysis
**Rejection Level Mathematics:**
The system analyzes candle wick patterns to project future pressure zones:
- **Upper Wick Analysis:** Identifies selling pressure and resistance zones
- **Lower Wick Analysis:** Identifies buying pressure and support zones
- **Pressure Projection:** Extends lines forward based on mathematical probability
**Multi-Layer Glow Effects:**
Wick pressure lines use progressive transparency (1-8 layers) creating natural glow effects that make pressure zones immediately visible without cluttering the chart.
### Enhanced Regime Background
**Dynamic Intensity Mapping:**
Background colors reflect mathematical regime strength:
- **Deep Transparency (98% alpha):** Subtle regime indication
- **Pulse Intensity:** Based on regime strength calculation
- **Color Coding:** Green (trending), Red (mean-reverting), Neutral (random)
**Smoothing Integration:**
Regime changes incorporate 10-bar smoothing to prevent background flicker while maintaining responsiveness to genuine regime shifts.
### Color Scheme System
**Six Professional Themes:**
- **Dark (Default):** Professional trading environment optimization
- **Light:** High ambient light conditions
- **Classic:** Traditional technical analysis appearance
- **Neon:** High-contrast visibility for active trading
- **Neutral:** Minimal distraction focus
- **Bright:** Maximum visibility for complex setups
Each theme maintains mathematical accuracy while optimizing visual clarity for different trading environments and personal preferences.
---
## 📊 INSTITUTIONAL-GRADE DASHBOARD
### Tensor Field Status Section
**Field Strength Display:**
Real-time Mahalanobis distance calculation with dynamic emoji indicators:
- **⚡ (Lightning):** Extreme field strength (>1.5× threshold)
- **● (Solid Circle):** Strong field activity (>1.0× threshold)
- **○ (Open Circle):** Normal field state
**Signal Quality Rating:**
Democratic algorithm assessment:
- **ELITE:** All 3 components aligned (highest probability)
- **STRONG:** 2 components aligned (good probability)
- **GOOD:** 1 component active (moderate probability)
- **WEAK:** No clear component signals
**Threshold and Anomaly Monitoring:**
- **Threshold Display:** Current mathematical threshold setting
- **Anomaly Level (0-100%):** Combined volatility and volume spike measurement
- **>70%:** High anomaly (red warning)
- **30-70%:** Moderate anomaly (orange caution)
- **<30%:** Normal conditions (green confirmation)
### Tensor State Analysis Section
**Mathematical State Classification:**
- **↑ BULL (Tensor State +1):** Trending regime with bullish bias
- **↓ BEAR (Tensor State -1):** Mean-reverting regime with bearish bias
- **◈ SUPER (Tensor State 0):** Random walk regime (neutral)
**Visual State Gauge:**
Five-circle progression showing tensor field polarity:
- **🟢🟢🟢⚪⚪:** Strong bullish mathematical alignment
- **⚪⚪🟡⚪⚪:** Neutral/transitional state
- **⚪⚪🔴🔴🔴:** Strong bearish mathematical alignment
**Trend Direction and Phase Analysis:**
- **📈 BULL / 📉 BEAR / ➡️ NEUTRAL:** Primary trend classification
- **🌪️ CHAOS:** Extreme information flow (>2.0 flow strength)
- **⚡ ACTIVE:** Strong information flow (1.0-2.0 flow strength)
- **😴 CALM:** Low information flow (<1.0 flow strength)
### Trading Signals Section
**Real-Time Signal Status:**
- **🟢 ACTIVE / ⚪ INACTIVE:** Long signal availability
- **🔴 ACTIVE / ⚪ INACTIVE:** Short signal availability
- **Components (X/3):** Active algorithmic components
- **Mode Display:** Current signal generation mode
**Signal Strength Visualization:**
Color-coded component count:
- **Green:** 3/3 components (maximum confidence)
- **Aqua:** 2/3 components (good confidence)
- **Orange:** 1/3 components (moderate confidence)
- **Gray:** 0/3 components (no signals)
### Performance Metrics Section
**Win Rate Monitoring:**
Estimated win rates based on signal quality with emoji indicators:
- **🔥 (Fire):** ≥60% estimated win rate
- **👍 (Thumbs Up):** 45-59% estimated win rate
- **⚠️ (Warning):** <45% estimated win rate
**Mathematical Metrics:**
- **Hurst Exponent:** Real-time fractal dimension (0.000-1.000)
- **Information Flow:** Volume/price leading indicators
- **📊 VOL:** Volume leading price (accumulation/distribution)
- **💰 PRICE:** Price leading volume (momentum/speculation)
- **➖ NONE:** Balanced information flow
- **Volatility Classification:**
- **🔥 HIGH:** Above 1.5× jump threshold
- **📊 NORM:** Normal volatility range
- **😴 LOW:** Below 0.5× jump threshold
### Market Structure Section (Large Dashboard)
**Regime Classification:**
- **📈 TREND:** Hurst >0.6, momentum strategies optimal
- **🔄 REVERT:** Hurst <0.4, contrarian strategies optimal
- **🎲 RANDOM:** Hurst ≈0.5, breakout strategies preferred
**Mathematical Field Analysis:**
- **Dimensions:** Current volatility space complexity (2D-5D)
- **Hawkes λ (Lambda):** Self-exciting jump intensity (0.00-1.00)
- **Jump Status:** 🚨 JUMP (active) / ✅ NORM (normal)
### Settings Summary Section (Large Dashboard)
**Active Configuration Display:**
- **Sensitivity:** Current master sensitivity setting
- **Lookback:** Primary analysis window
- **Theme:** Active color scheme
- **Method:** Hurst calculation method (Classic R/S, Adaptive R/S, DFA)
**Dashboard Sizing Options:**
- **Small:** Essential metrics only (mobile/small screens)
- **Normal:** Balanced information density (standard desktop)
- **Large:** Maximum detail (multi-monitor setups)
**Position Options:**
- **Top Right:** Standard placement (avoids price action)
- **Top Left:** Wide chart optimization
- **Bottom Right:** Recent price focus (scalping)
- **Bottom Left:** Maximum price visibility (swing trading)
---
## 🎯 SIGNAL GENERATION LOGIC
### Multi-Component Convergence System
**Component Signal Architecture:**
The TMAE generates signals through sophisticated component analysis rather than simple threshold crossing:
**Volatility Component:**
- **Jump Detection:** Mahalanobis distance threshold breach
- **Hawkes Intensity:** Self-exciting process activation (>0.2)
- **Multi-dimensional:** Considers all volatility dimensions simultaneously
**Hurst Regime Component:**
- **Trending Markets:** Price above SMA-20 with positive momentum
- **Mean-Reverting Markets:** Price at Bollinger Band extremes
- **Random Markets:** Bollinger squeeze breakouts with directional confirmation
**Transfer Entropy Component:**
- **Volume Leadership:** Information flow from volume to price
- **Volume Spike:** Volume 110%+ above 20-period average
- **Flow Significance:** Above entropy threshold with directional bias
### Democratic Signal Weighting
**Signal Mode Implementation:**
- **Aggressive Mode:** Any single component triggers signal
- **Confluence Mode:** Minimum 2 components must agree
- **Conservative Mode:** All 3 components must align
**Momentum Confirmation:**
All signals require momentum confirmation:
- **Long Signals:** RSI >50 AND price >EMA-9
- **Short Signals:** RSI <50 AND price 0.6):**
- **Increase Sensitivity:** Catch momentum continuation
- **Lower Mean Reversion Threshold:** Avoid counter-trend signals
- **Emphasize Volume Leadership:** Institutional accumulation/distribution
- **Tensor Field Focus:** Use expansion for trend continuation
- **Signal Mode:** Aggressive or Confluence for trend following
**Range-Bound Markets (Hurst <0.4):**
- **Decrease Sensitivity:** Avoid false breakouts
- **Lower Trending Threshold:** Quick regime recognition
- **Focus on Price Leadership:** Retail sentiment extremes
- **Fractal Grid Emphasis:** Support/resistance trading
- **Signal Mode:** Conservative for high-probability reversals
**Volatile Markets (High Jump Frequency):**
- **Increase Hawkes Decay:** Recognize event clustering
- **Higher Jump Threshold:** Avoid noise signals
- **Maximum Dimensions:** Capture full volatility complexity
- **Reduce Position Sizing:** Risk management adaptation
- **Enhanced Visuals:** Maximum information for rapid decisions
**Low Volatility Markets (Low Jump Frequency):**
- **Decrease Jump Threshold:** Capture subtle movements
- **Lower Hawkes Decay:** Treat moves as independent
- **Reduce Dimensions:** Simplify analysis
- **Increase Position Sizing:** Capitalize on compressed volatility
- **Minimal Visuals:** Reduce distraction in quiet markets
---
## 🚀 ADVANCED TRADING STRATEGIES
### The Mathematical Convergence Method
**Entry Protocol:**
1. **Fractal Grid Approach:** Monitor price approaching significant fractal levels
2. **Tensor Field Confirmation:** Verify field expansion supporting direction
3. **Portal Signal:** Wait for dimensional portal appearance
4. **ELITE/STRONG Quality:** Only trade highest quality mathematical signals
5. **Component Consensus:** Confirm 2+ components agree in Confluence mode
**Example Implementation:**
- Price approaching 21-period fractal high
- Tensor field expanding upward (bullish mathematical alignment)
- Green portal appears below price (trending regime confirmation)
- ELITE quality signal with 3/3 components active
- Enter long position with stop below fractal level
**Risk Management:**
- **Stop Placement:** Below/above fractal level that generated signal
- **Position Sizing:** Based on Mahalanobis distance (higher distance = smaller size)
- **Profit Targets:** Next fractal level or tensor field resistance
### The Regime Transition Strategy
**Regime Change Detection:**
1. **Monitor Hurst Exponent:** Watch for persistent moves above/below thresholds
2. **Portal Color Change:** Regime transitions show different portal colors
3. **Background Intensity:** Increasing regime background intensity
4. **Mathematical Confirmation:** Wait for regime confirmation (hysteresis)
**Trading Implementation:**
- **Trending Transitions:** Trade momentum breakouts, follow trend
- **Mean Reversion Transitions:** Trade range boundaries, fade extremes
- **Random Transitions:** Trade breakouts with tight stops
**Advanced Techniques:**
- **Multi-Timeframe:** Confirm regime on higher timeframe
- **Early Entry:** Enter on regime transition rather than confirmation
- **Regime Strength:** Larger positions during strong regime signals
### The Information Flow Momentum Strategy
**Flow Detection Protocol:**
1. **Monitor Transfer Entropy:** Watch for significant information flow shifts
2. **Volume Leadership:** Strong edge when volume leads price
3. **Flow Acceleration:** Increasing flow strength indicates momentum
4. **Directional Confirmation:** Ensure flow aligns with intended trade direction
**Entry Signals:**
- **Volume → Price Flow:** Enter during accumulation/distribution phases
- **Price → Volume Flow:** Enter on momentum confirmation breaks
- **Flow Reversal:** Counter-trend entries when flow reverses
**Optimization:**
- **Scalping:** Use immediate flow detection (2-5 bar lag)
- **Swing Trading:** Use structural flow (10-20 bar lag)
- **Multi-Asset:** Compare flow between correlated assets
### The Tensor Field Expansion Strategy
**Field Mathematics:**
The tensor field expansion indicates mathematical pressure building in market structure:
**Expansion Phases:**
1. **Compression:** Field contracts, volatility decreases
2. **Tension Building:** Mathematical pressure accumulates
3. **Expansion:** Field expands rapidly with directional movement
4. **Resolution:** Field stabilizes at new equilibrium
**Trading Applications:**
- **Compression Trading:** Prepare for breakout during field contraction
- **Expansion Following:** Trade direction of field expansion
- **Reversion Trading:** Fade extreme field expansion
- **Multi-Dimensional:** Consider all field layers for confirmation
### The Hawkes Process Event Strategy
**Self-Exciting Jump Trading:**
Understanding that market shocks cluster and create follow-on opportunities:
**Jump Sequence Analysis:**
1. **Initial Jump:** First volatility jump detected
2. **Clustering Phase:** Hawkes intensity remains elevated
3. **Follow-On Opportunities:** Additional jumps more likely
4. **Decay Period:** Intensity gradually decreases
**Implementation:**
- **Jump Confirmation:** Wait for mathematical jump confirmation
- **Direction Assessment:** Use other components for direction
- **Clustering Trades:** Trade subsequent moves during high intensity
- **Decay Exit:** Exit positions as Hawkes intensity decays
### The Fractal Confluence System
**Multi-Timeframe Fractal Analysis:**
Combining fractal levels across different periods for high-probability zones:
**Confluence Zones:**
- **Double Confluence:** 2 fractal levels align
- **Triple Confluence:** 3+ fractal levels cluster
- **Mathematical Confirmation:** Tensor field supports the level
- **Information Flow:** Transfer entropy confirms direction
**Trading Protocol:**
1. **Identify Confluence:** Find 2+ fractal levels within 1 ATR
2. **Mathematical Support:** Verify tensor field alignment
3. **Signal Quality:** Wait for STRONG or ELITE signal
4. **Risk Definition:** Use fractal level for stop placement
5. **Profit Targeting:** Next major fractal confluence zone
---
## ⚠️ COMPREHENSIVE RISK MANAGEMENT
### Mathematical Position Sizing
**Mahalanobis Distance Integration:**
Position size should inversely correlate with mathematical field strength:
```
Position Size = Base Size × (Threshold / Mahalanobis Distance)
```
**Risk Scaling Matrix:**
- **Low Field Strength (<2.0):** Standard position sizing
- **Moderate Field Strength (2.0-3.0):** 75% position sizing
- **High Field Strength (3.0-4.0):** 50% position sizing
- **Extreme Field Strength (>4.0):** 25% position sizing or no trade
### Signal Quality Risk Adjustment
**Quality-Based Position Sizing:**
- **ELITE Signals:** 100% of planned position size
- **STRONG Signals:** 75% of planned position size
- **GOOD Signals:** 50% of planned position size
- **WEAK Signals:** No position or paper trading only
**Component Agreement Scaling:**
- **3/3 Components:** Full position size
- **2/3 Components:** 75% position size
- **1/3 Components:** 50% position size or skip trade
### Regime-Adaptive Risk Management
**Trending Market Risk:**
- **Wider Stops:** Allow for trend continuation
- **Trend Following:** Trade with regime direction
- **Higher Position Size:** Trend probability advantage
- **Momentum Stops:** Trail stops based on momentum indicators
**Mean-Reverting Market Risk:**
- **Tighter Stops:** Quick exits on trend continuation
- **Contrarian Positioning:** Trade against extremes
- **Smaller Position Size:** Higher reversal failure rate
- **Level-Based Stops:** Use fractal levels for stops
**Random Market Risk:**
- **Breakout Focus:** Trade only clear breakouts
- **Tight Initial Stops:** Quick exit if breakout fails
- **Reduced Frequency:** Skip marginal setups
- **Range-Based Targets:** Profit targets at range boundaries
### Volatility-Adaptive Risk Controls
**High Volatility Periods:**
- **Reduced Position Size:** Account for wider price swings
- **Wider Stops:** Avoid noise-based exits
- **Lower Frequency:** Skip marginal setups
- **Faster Exits:** Take profits more quickly
**Low Volatility Periods:**
- **Standard Position Size:** Normal risk parameters
- **Tighter Stops:** Take advantage of compressed ranges
- **Higher Frequency:** Trade more setups
- **Extended Targets:** Allow for compressed volatility expansion
### Multi-Timeframe Risk Alignment
**Higher Timeframe Trend:**
- **With Trend:** Standard or increased position size
- **Against Trend:** Reduced position size or skip
- **Neutral Trend:** Standard position size with tight management
**Risk Hierarchy:**
1. **Primary:** Current timeframe signal quality
2. **Secondary:** Higher timeframe trend alignment
3. **Tertiary:** Mathematical field strength
4. **Quaternary:** Market regime classification
---
## 📚 EDUCATIONAL VALUE AND MATHEMATICAL CONCEPTS
### Advanced Mathematical Concepts
**Tensor Analysis in Markets:**
The TMAE introduces traders to tensor analysis, a branch of mathematics typically reserved for physics and advanced engineering. Tensors provide a framework for understanding multi-dimensional market relationships that scalar and vector analysis cannot capture.
**Information Theory Applications:**
Transfer entropy implementation teaches traders about information flow in markets, a concept from information theory that quantifies directional causality between variables. This provides intuition about market microstructure and participant behavior.
**Fractal Geometry in Trading:**
The Hurst exponent calculation exposes traders to fractal geometry concepts, helping understand that markets exhibit self-similar patterns across multiple timeframes. This mathematical insight transforms how traders view market structure.
**Stochastic Process Theory:**
The Hawkes process implementation introduces concepts from stochastic process theory, specifically self-exciting point processes. This provides mathematical framework for understanding why market events cluster and exhibit memory effects.
### Learning Progressive Complexity
**Beginner Mathematical Concepts:**
- **Volatility Dimensions:** Understanding multi-dimensional analysis
- **Regime Classification:** Learning market personality types
- **Signal Democracy:** Algorithmic consensus building
- **Visual Mathematics:** Interpreting mathematical concepts visually
**Intermediate Mathematical Applications:**
- **Mahalanobis Distance:** Statistical distance in multi-dimensional space
- **Rescaled Range Analysis:** Fractal dimension measurement
- **Information Entropy:** Quantifying uncertainty and causality
- **Field Theory:** Understanding mathematical fields in market context
**Advanced Mathematical Integration:**
- **Tensor Field Dynamics:** Multi-dimensional market force analysis
- **Stochastic Self-Excitation:** Event clustering and memory effects
- **Categorical Composition:** Mathematical signal combination theory
- **Topological Market Analysis:** Understanding market shape and connectivity
### Practical Mathematical Intuition
**Developing Market Mathematics Intuition:**
The TMAE serves as a bridge between abstract mathematical concepts and practical trading applications. Traders develop intuitive understanding of:
- **How markets exhibit mathematical structure beneath apparent randomness**
- **Why multi-dimensional analysis reveals patterns invisible to single-variable approaches**
- **How information flows through markets in measurable, predictable ways**
- **Why mathematical models provide probabilistic edges rather than certainties**
---
## 🔬 IMPLEMENTATION AND OPTIMIZATION
### Getting Started Protocol
**Phase 1: Observation (Week 1)**
1. **Apply with defaults:** Use standard settings on your primary trading timeframe
2. **Study visual elements:** Learn to interpret tensor fields, portals, and streams
3. **Monitor dashboard:** Observe how metrics change with market conditions
4. **No trading:** Focus entirely on pattern recognition and understanding
**Phase 2: Pattern Recognition (Week 2-3)**
1. **Identify signal patterns:** Note what market conditions produce different signal qualities
2. **Regime correlation:** Observe how Hurst regimes affect signal performance
3. **Visual confirmation:** Learn to read tensor field expansion and portal signals
4. **Component analysis:** Understand which components drive signals in different markets
**Phase 3: Parameter Optimization (Week 4-5)**
1. **Asset-specific tuning:** Adjust parameters for your specific trading instrument
2. **Timeframe optimization:** Fine-tune for your preferred trading timeframe
3. **Sensitivity adjustment:** Balance signal frequency with quality
4. **Visual customization:** Optimize colors and intensity for your trading environment
**Phase 4: Live Implementation (Week 6+)**
1. **Paper trading:** Test signals with hypothetical trades
2. **Small position sizing:** Begin with minimal risk during learning phase
3. **Performance tracking:** Monitor actual vs. expected signal performance
4. **Continuous optimization:** Refine settings based on real performance data
### Performance Monitoring System
**Signal Quality Tracking:**
- **ELITE Signal Win Rate:** Track highest quality signals separately
- **Component Performance:** Monitor which components provide best signals
- **Regime Performance:** Analyze performance across different market regimes
- **Timeframe Analysis:** Compare performance across different session times
**Mathematical Metric Correlation:**
- **Field Strength vs. Performance:** Higher field strength should correlate with better performance
- **Component Agreement vs. Win Rate:** More component agreement should improve win rates
- **Regime Alignment vs. Success:** Trading with mathematical regime should outperform
### Continuous Optimization Process
**Monthly Review Protocol:**
1. **Performance Analysis:** Review win rates, profit factors, and maximum drawdown
2. **Parameter Assessment:** Evaluate if current settings remain optimal
3. **Market Adaptation:** Adjust for changes in market character or volatility
4. **Component Weighting:** Consider if certain components should receive more/less emphasis
**Quarterly Deep Analysis:**
1. **Mathematical Model Validation:** Verify that mathematical relationships remain valid
2. **Regime Distribution:** Analyze time spent in different market regimes
3. **Signal Evolution:** Track how signal characteristics change over time
4. **Correlation Analysis:** Monitor correlations between different mathematical components
---
## 🌟 UNIQUE INNOVATIONS AND CONTRIBUTIONS
### Revolutionary Mathematical Integration
**First-Ever Implementations:**
1. **Multi-Dimensional Volatility Tensor:** First indicator to implement true tensor analysis for market volatility
2. **Real-Time Hawkes Process:** First trading implementation of self-exciting point processes
3. **Transfer Entropy Trading Signals:** First practical application of information theory for trade generation
4. **Democratic Component Voting:** First algorithmic consensus system for signal generation
5. **Fractal-Projected Signal Quality:** First system to predict signal quality at future price levels
### Advanced Visualization Innovations
**Mathematical Visualization Breakthroughs:**
- **Tensor Field Radiation:** Visual representation of mathematical field energy
- **Dimensional Portal System:** Category theory visualization for regime transitions
- **Information Flow Streams:** Real-time visual display of market information transfer
- **Multi-Layer Fractal Grid:** Intelligent spacing and projection system
- **Regime Intensity Mapping:** Dynamic background showing mathematical regime strength
### Practical Trading Innovations
**Trading System Advances:**
- **Quality-Weighted Signal Generation:** Signals rated by mathematical confidence
- **Regime-Adaptive Strategy Selection:** Automatic strategy optimization based on market personality
- **Anti-Spam Signal Protection:** Mathematical prevention of signal clustering
- **Component Performance Tracking:** Real-time monitoring of algorithmic component success
- **Field-Strength Position Sizing:** Mathematical volatility integration for risk management
---
## ⚖️ RESPONSIBLE USAGE AND LIMITATIONS
### Mathematical Model Limitations
**Understanding Model Boundaries:**
While the TMAE implements sophisticated mathematical concepts, traders must understand fundamental limitations:
- **Markets Are Not Purely Mathematical:** Human psychology, news events, and fundamental factors create unpredictable elements
- **Past Performance Limitations:** Mathematical relationships that worked historically may not persist indefinitely
- **Model Risk:** Complex models can fail during unprecedented market conditions
- **Overfitting Potential:** Highly optimized parameters may not generalize to future market conditions
### Proper Implementation Guidelines
**Risk Management Requirements:**
- **Never Risk More Than 2% Per Trade:** Regardless of signal quality
- **Diversification Mandatory:** Don't rely solely on mathematical signals
- **Position Sizing Discipline:** Use mathematical field strength for sizing, not confidence
- **Stop Loss Non-Negotiable:** Every trade must have predefined risk parameters
**Realistic Expectations:**
- **Mathematical Edge, Not Certainty:** The indicator provides probabilistic advantages, not guaranteed outcomes
- **Learning Curve Required:** Complex mathematical concepts require time to master
- **Market Adaptation Necessary:** Parameters must evolve with changing market conditions
- **Continuous Education Important:** Understanding underlying mathematics improves application
### Ethical Trading Considerations
**Market Impact Awareness:**
- **Information Asymmetry:** Advanced mathematical analysis may provide advantages over other market participants
- **Position Size Responsibility:** Large positions based on mathematical signals can impact market structure
- **Sharing Knowledge:** Consider educational contributions to trading community
- **Fair Market Participation:** Use mathematical advantages responsibly within market framework
### Professional Development Path
**Skill Development Sequence:**
1. **Basic Mathematical Literacy:** Understand fundamental concepts before advanced application
2. **Risk Management Mastery:** Develop disciplined risk control before relying on complex signals
3. **Market Psychology Understanding:** Combine mathematical analysis with behavioral market insights
4. **Continuous Learning:** Stay updated on mathematical finance developments and market evolution
---
## 🔮 CONCLUSION
The Tensor Market Analysis Engine represents a quantum leap forward in technical analysis, successfully bridging the gap between advanced pure mathematics and practical trading applications. By integrating multi-dimensional volatility analysis, fractal market theory, and information flow dynamics, the TMAE reveals market structure invisible to conventional analysis while maintaining visual clarity and practical usability.
### Mathematical Innovation Legacy
This indicator establishes new paradigms in technical analysis:
- **Tensor analysis for market volatility understanding**
- **Stochastic self-excitation for event clustering prediction**
- **Information theory for causality-based trade generation**
- **Democratic algorithmic consensus for signal quality enhancement**
- **Mathematical field visualization for intuitive market understanding**
### Practical Trading Revolution
Beyond mathematical innovation, the TMAE transforms practical trading:
- **Quality-rated signals replace binary buy/sell decisions**
- **Regime-adaptive strategies automatically optimize for market personality**
- **Multi-dimensional risk management integrates mathematical volatility measures**
- **Visual mathematical concepts make complex analysis immediately interpretable**
- **Educational value creates lasting improvement in trading understanding**
### Future-Proof Design
The mathematical foundations ensure lasting relevance:
- **Universal mathematical principles transcend market evolution**
- **Multi-dimensional analysis adapts to new market structures**
- **Regime detection automatically adjusts to changing market personalities**
- **Component democracy allows for future algorithmic additions**
- **Mathematical visualization scales with increasing market complexity**
### Commitment to Excellence
The TMAE represents more than an indicator—it embodies a philosophy of bringing rigorous mathematical analysis to trading while maintaining practical utility and visual elegance. Every component, from the multi-dimensional tensor fields to the democratic signal generation, reflects a commitment to mathematical accuracy, trading practicality, and educational value.
### Trading with Mathematical Precision
In an era where markets grow increasingly complex and computational, the TMAE provides traders with mathematical tools previously available only to institutional quantitative research teams. Yet unlike academic mathematical models, the TMAE translates complex concepts into intuitive visual representations and practical trading signals.
By combining the mathematical rigor of tensor analysis, the statistical power of multi-dimensional volatility modeling, and the information-theoretic insights of transfer entropy, traders gain unprecedented insight into market structure and dynamics.
### Final Perspective
Markets, like nature, exhibit profound mathematical beauty beneath apparent chaos. The Tensor Market Analysis Engine serves as a mathematical lens that reveals this hidden order, transforming how traders perceive and interact with market structure.
Through mathematical precision, visual elegance, and practical utility, the TMAE empowers traders to see beyond the noise and trade with the confidence that comes from understanding the mathematical principles governing market behavior.
Trade with mathematical insight. Trade with the power of tensors. Trade with the TMAE.
*"In mathematics, you don't understand things. You just get used to them." - John von Neumann*
*With the TMAE, mathematical market understanding becomes not just possible, but intuitive.*
— Dskyz, Trade with insight. Trade with anticipation.

Volume Profile & Smart Money Explorer🔍 Volume Profile & Smart Money Explorer: Decode Institutional Footprints
Master the art of institutional trading with this sophisticated volume analysis tool. Track smart money movements, identify peak liquidity windows, and align your trades with major market participants.
🌟 Key Features:
📊 Triple-Layer Volume Analysis
• Total Volume Patterns
• Directional Volume Split (Up/Down)
• Institutional Flow Detection
• Real-time Smart Money Tracking
• Historical Pattern Recognition
⚡ Smart Money Detection
• Institutional Trade Identification
• Large Block Order Tracking
• Smart Money Concentration Periods
• Whale Activity Alerts
• Volume Threshold Analysis
📈 Advanced Profiling
• Hourly Volume Distribution
• Directional Bias Analysis
• Liquidity Heat Maps
• Volume Pattern Recognition
• Custom Threshold Settings
🎯 Strategic Applications:
Institutional Trading:
• Track Big Player Movements
• Identify Accumulation/Distribution
• Follow Smart Money Flow
• Detect Institutional Trading Windows
• Monitor Block Orders
Risk Management:
• Identify High Liquidity Windows
• Avoid Thin Market Periods
• Optimize Position Sizing
• Track Market Participation
• Monitor Volume Quality
Market Analysis:
• Volume Pattern Recognition
• Smart Money Flow Analysis
• Liquidity Window Identification
• Institutional Activity Cycles
• Market Depth Analysis
💡 Perfect For:
• Professional Traders
• Volume Profile Traders
• Institutional Traders
• Risk Managers
• Algorithmic Traders
• Smart Money Followers
• Day Traders
• Swing Traders
📊 Key Metrics:
• Normalized Volume Profiles
• Institutional Thresholds
• Directional Volume Split
• Smart Money Concentration
• Historical Patterns
• Real-time Analysis
⚡ Trading Edge:
• Trade with Institution Flow
• Identify Optimal Entry Points
• Recognize Distribution Patterns
• Follow Smart Money Positioning
• Avoid Thin Markets
• Capitalize on Peak Liquidity
🎓 Educational Value:
• Understand Market Structure
• Learn Volume Analysis
• Master Institutional Patterns
• Develop Market Intuition
• Track Smart Money Flow
🛠️ Customization:
• Adjustable Time Windows
• Flexible Volume Thresholds
• Multiple Timeframe Analysis
• Custom Alert Settings
• Visual Preference Options
Whether you're tracking institutional flows in crypto markets or following smart money in traditional markets, the Volume Profile & Smart Money Explorer provides the deep insights needed to trade alongside the biggest players.
Transform your trading from retail guesswork to institutional precision. Know exactly when and where smart money moves, and position yourself ahead of major market shifts.
#VolumeProfile #SmartMoney #InstitutionalTrading #MarketAnalysis #TradingView #VolumeAnalysis #CryptoTrading #ForexTrading #TechnicalAnalysis #Trading #PriceAction #MarketStructure #OrderFlow #Liquidity #RiskManagement #TradingStrategy #DayTrading #SwingTrading #AlgoTrading #QuantitativeTrading

Flexible S/R Channels🟩 Flexible S/R Channels is a visualization tool that draws curved support and resistance boundaries through user-defined anchor points. Unlike traditional trendlines and channels that force linear interpretation onto price action, this indicator captures the curved structures that markets frequently form—rounded tops and bottoms, parabolic advances and declines, arcing rallies and pullbacks. Three anchor points per curve define the shape; the indicator fits a smooth mathematical curve through these points and projects it forward. The approach is simple: draw what you see. Curved market structure that resists precise definition with traditional tools can now be rendered with mathematical accuracy.
The indicator bridges the gap between static drawing tools and programmable indicators. TradingView's arc tool draws curves but produces only visual pixels with no analytical value. Flexible S/R Channels creates live data series that integrate with other analysis tools. Four curve-fitting methods—Quadratic, Quadratic-Linear, Weighted Linear, and Natural Cubic Spline—accommodate different market structures. The curved levels naturally lend themselves to breakout and reversion strategies—applications left to the trader's discretion. The open-source code invites experimentation and customization.
💡 THEORY AND CONCEPT 💡
Traders have long relied on horizontal levels and diagonal trendlines to define support and resistance. Linear tools assume constant slope—a property rarely exhibited by actual market movement. When momentum accelerates or decelerates, price trajectories curve rather than hold to fixed angles. The resulting structures—parabolic advances during expansion phases, arcing pullbacks during consolidation, rounded formations at reversal points—represent changes in the rate of change itself. Traditional drawing tools cannot accommodate this variable geometry without sacrificing mathematical precision..
Flexible S/R Channels extends familiar support and resistance concepts into curved space. The approach is simple: draw what you see. When the eye recognizes a curved boundary in price action, this indicator provides the means to define it precisely. Three anchor points per curve—an initial point, an intermediate point, and a recent point—are all that is required. The indicator fits a smooth mathematical curve through these points and extends it forward as a projection.
This indicator represents a blend of human pattern recognition and algorithmic precision. Fully automated indicators make decisions without user input—efficient but detached from trader discretion. Manual drawing tools rely entirely on freehand skill—expressive but imprecise. Flexible S/R Channels occupies the middle ground. The trader identifies the curved structure; the algorithm renders it mathematically. The result is human insight expressed with computational accuracy—for traders who recognize curved structure in price action but lack precise tools to define it.
This projection is not a prediction. It is a visual hypothesis—a structured way of asking "if this trajectory continues, where would price be?" The underlying assumption is simple: like Newton's first law of motion, a trajectory in motion tends to continue unless acted upon by an external force. Future price action validates or invalidates the projection, just as it does with any trendline or channel.
TradingView offers an arc drawing tool for freehand curved lines, but these are purely visual—static pixels on a screen with no programmable value. Flexible S/R Channels bridges this gap. The fitted curves exist as data series that can generate alerts, trigger signals, and interact with other analysis tools. The visual drawing becomes operational structure.
🔁 CURVE METHODS 🔁
The indicator offers four curve-calculation methods, each producing different shapes suited to different market structures:
Quadratic — Fits a parabolic arc through the three anchor points. Best for smooth, continuous curves such as rounded tops and bottoms. It captures the natural "swing" of the market, assuming the momentum will maintain its current rate of acceleration or deceleration.
Quadratic-Linear — Uses a parabolic curve through the anchor points, then transitions to a straight line after the final anchor. Useful when curved structure gives way to linear trend continuation. This is the "bridge" between a turning market and a steady, directed move, preventing the projection from curving back on itself when the price begins to run.
Weighted Linear — Connects anchor points with straight line segments rather than a smooth curve. Suited for angular market structures with distinct inflection points. It treats the market as a series of rigid shifts, providing a clear "corridor" when the price is bouncing between sharp, diagonal levels.
Natural Cubic Spline — Produces the smoothest curve by minimizing abrupt directional changes. Ideal for organic, flowing market movements. It acts as a flexible spine that adapts to complex transitions without the rigid constraints of a fixed geometric shape.
Quadratic Fitting : A smooth, parabolic arc defines a curved resistance boundary. By fitting a mathematical path through three anchor points, the curve captures rounded structures and arcing price action that traditional linear trendlines fail to represent.
Weighted Linear Fitting : This method produces an angular, segmented path by connecting anchor points with distinct linear slopes. Unlike the continuous smoothness of a quadratic arc, the weighted linear approach creates a more jointed geometry, allowing for a precise match to market structures that exhibit sharp, localized changes in trajectory.
Natural Cubic Spline Fitting : This method creates a highly fluid, elastic curve that can accommodate complex price oscillations. In this instance, the curves define a narrowing range as support and resistance converge, highlighting the volatility compression that often precedes a significant breakout or breakdown from established structures.
🖱️ HOW IT WORKS 🖱️
1️⃣ Initial Setup
Unlike traditional indicators that calculate values automatically from price data, Flexible S/R Channels requires user-defined anchor points. This is intentional. The trader's eye is the pattern recognition engine—no algorithm can see the curved structure that experience and intuition reveal. The indicator waits for this input, then applies mathematical precision to render what the trader has identified.
The Recognition of Natural Structure : Effective analysis begins when a curved rhythm becomes visible within price action that traditional trendlines cannot satisfy. Identifying the specific swing highs and swing lows that define these boundaries is the first step in organizing a chart. By isolating three key pivots for resistance and three for support, the underlying framework of the market's trajectory is established, providing the necessary coordinates to accurately map the path.
Interactive Setup Workflow : Upon loading, the indicator prompts for the sequential selection of six points—three swing highs and three swing lows—to serve as the raw data for the calculation. While the chart remains blank during this initial phase, the curves generate instantly once the final anchor is confirmed. These points are not permanent; they appear as interactive grips that can be dragged in real time to refine the boundaries as the market structure evolves.
The indicator prompts for six sequential selections—three for resistance, three for support. The first three selections define the resistance boundary; the final three define support. This sequential grouping is distinct from zigzag-style selection patterns. Within each group, clicking order is flexible—the algorithm automatically sorts points chronologically, allowing traders to select visually prominent pivots in whatever sequence feels natural.
Structural Anchor Identification : Identifying three key swing highs and three key swing lows provides the foundation for the dual-curve geometry. These specific structural peaks and troughs serve as the coordinates for the mathematical models, ensuring that the resulting boundaries accurately reflect the underlying skeleton of the market action.
2️⃣ Interactive Adjustment
After the initial setup, all six anchor points are fully adjustable:
Points are automatically sorted chronologically regardless of selection order
Grip handles appear at each anchor location
Any point can be repositioned by clicking and dragging its grip handle
The curves recalculate instantly as points are adjusted
The algorithm produces a mathematically perfect curve based on the anchor points provided. If the result does not match the trader's vision, adjustments are immediate. This iterative refinement—see, adjust, refine—continues until the rendered curve represents what the trader sees in the price action. The user remains in control; the algorithm remains in service.
Interactive Channel Boundaries : Six user-defined anchor points—three for resistance and three for support —establish a non-linear range that moves beyond the constraints of a flat, horizontal channel. This configuration captures the arcing trajectory of the market while showing price action respecting the curved boundaries in a classic reversion pattern. By manually positioning these anchors, a dynamic dimension is added to the chart that maintains structural integrity even as the price follows a rounded path.
🛠️ SETTINGS 🛠️
Customizable Visual Feedback : Beyond the core geometry, the visualization offers various user-defined settings to tailor the chart's information density. From identifying specific price targets to toggling structural labels, these options allow the trader to adjust the level of detail to suit their personal analysis style while maintaining a clear view of the non-linear boundaries.
Configuration Options
Curve Method — Select the curve-fitting algorithm: Quadratic, Quadratic-Linear, Weighted Linear, or Natural Cubic Spline.
Projection Length — Number of bars to project the curves beyond current price action. Projections appear as dashed lines.
Visual Settings
Grip Size — Size of the draggable handles displayed at each anchor point. Set to zero to hide grips entirely.
Line Width — Thickness of the support and resistance curves.
Support Color / Resistance Color — Color settings for each curve.
Show Info Table — Toggle display of the info table showing the current curve method in the chart corner.
Advanced: Time/Price Coordinates
The settings panel includes precise time and price values for each of the six anchor points, grouped under Resistance Time/Price and Support Time/Price. These values are populated automatically when points are selected on the chart.
Adjusting anchor points by dragging the grip handles directly on the chart is faster and more intuitive. The time/price fields are available for situations requiring exact coordinate entry—such as aligning an anchor to a specific candle timestamp or a precise price level. These fields can be safely ignored unless fine-tuning is necessary.
🖼️ CHART EXAMPLES 🖼️
The Flexible S/R Channels indicator adapts to diverse market structures across multiple timeframes and instruments. Curved boundaries can define subtle momentum shifts in near-linear trends, dramatic reversals in rounding formations, or volatility compression as channels converge toward breakout points. The four curve-fitting methods accommodate different geometries—smooth parabolic arcs for continuous momentum changes, segmented linear paths for angular structures, and elastic splines for complex oscillations. Each anchor point adjustment instantly recalculates the curves, allowing iterative refinement until the rendered boundaries align with the trader's interpretation of market structure. Forward projections extend these mathematical relationships into future territory, providing visual context for hypothetical support and resistance levels if current trajectories persist.
Subtle Curve Alignment : Even in structures that appear linear, subtle curvature allows the channel boundaries to breathe with the market’s internal momentum. By utilizing three anchor points rather than two, the channel adapts to the slight acceleration of a trend, providing a more precise fit than a rigid, straight corridor.
Decelerating Momentum and Convergence : This classic rounding structure illustrates a transition where the initial wide oscillations between highs and lows begin to contract. As the boundaries converge, the curve captures the diminishing volatility and the shift in market energy, providing a clear visual representation of a trend losing its expansive momentum as it approaches a potential turning point.
Organic Trend Modeling : In an accelerating uptrend, the Natural Cubic Spline provides a highly adaptable boundary that mirrors the organic flow of momentum. This non-traditional approach allows the channel to follow complex price pulses that a standard linear trendline would likely cut through, maintaining a precise fit even as the angle of the trend shifts over time.
Non-Linear Projections : Unlike standard trendlines that converge at a fixed rate, curved projections adapt to the historical momentum of the move. This allows the indicator to map a dynamic squeeze, capturing the subtle nuances of how price action tightens toward an apex. It provides a more sophisticated view of future convergence points that traditional linear channels often fail to anticipate.
The "Draw What You See" Philosophy : Market structures are rarely perfect, and this example highlights the indicator’s ability to map unconventional rhythms. Rather than forcing price into a predefined category, the tool remains flexible enough to define any structural path the trader identifies. If you can see a trend's trajectory, the indicator can provide the mathematical framework to support it.
Comparative Projection Modeling : Using identical anchor points as above, this example demonstrates how selecting a different calculation method can alter the projected path. While the historical fit remains precise, the variation in the forward-looking trajectory allows traders to explore multiple mathematical interpretations of the same market structure, choosing the model that best aligns with the current volatility and trend behavior.
Extended Timeframe Channel Definition : This multi-year perspective demonstrates the indicator's ability to define curved channel boundaries across extended timeframes spanning hundreds of bars and multiple market cycles. The resistance curve captures the rounded distribution of swing highs while the support curve follows the accelerating base formation, creating a non-linear channel that frames long-term structural trends more precisely than traditional parallel channels or static trendlines.
Rounding Bottom Reversal and Channel Convergence : This example captures a classic rounding bottom formation—a reversal pattern that linear tools cannot adequately define. The Quadratic method produces a smooth parabolic arc through the resistance anchors, tracing the deceleration of the downtrend, the capitulation low, and the subsequent re-acceleration upward as a single continuous curve. The support boundary mirrors this momentum shift from below, creating a curved channel that narrows toward current price. This convergence represents structural compression—the boundaries tightening as volatility contracts and directional resolution approaches. Price action oscillates within these non-linear boundaries, demonstrating that channel behavior persists even when the geometry is curved rather than parallel. The projection extends both curves forward, mapping the hypothetical trajectory if the current momentum structure continues, providing visual context for potential breakout or breakdown levels as the channel reaches its apex.
Built-in Precision vs. Algorithmic Power : While TradingView offers basic curve drawing tools (shown here as dashed lines), the Flexible S/R Channels indicator elevates this concept into a functional analytical framework. By converting manual observations into mathematical models, it moves beyond mere drawing to provide a data-driven structure that can be utilized for advanced technical analysis and future Pine Script trading logic.
⚙️ TECHNICAL DETAILS ⚙️
Curve Fitting vs. Overfitting: The term curve fitting often carries negative connotations in quantitative analysis due to its association with overfitting—the practice of adjusting a model until it perfectly matches historical data, producing an illusion of accuracy that fails when applied to new data. The application here is fundamentally different. Flexible S/R Channels does not optimize parameters to maximize historical fit; it constructs a mathematical curve through user-selected anchor points, then projects that curve into unknown territory. The curve is not fitted to price data—it is fitted to structural pivots identified by the trader. The projection represents a hypothesis about trajectory continuation, not a prediction derived from statistical optimization. Future price action validates or invalidates this hypothesis in real time, exactly as it does with any trendline or channel. The anchor points remain fixed unless manually adjusted, ensuring the curve does not adapt to new data retroactively.
Non-Repainting Behavior: The indicator does not repaint historical bars. The mathematical coefficients that define each curve are calculated once—when the final anchor point is set—and stored as fixed values. These coefficients remain constant unless an anchor point is manually repositioned. The backfit polyline is drawn once using these coefficients, spanning the known range from the first to last anchor point. The plot() function applies the same coefficients to each subsequent bar, updating in real-time as new bars form but never altering previously plotted values. The projection polyline extends forward from the current bar using the same fixed coefficients, projecting a user-defined number of future bars (maximum 500). This projection redraws on each tick to maintain its position relative to the moving current bar, but the mathematical trajectory remains constant—only the starting point advances. The current bar's curve value will update tick-by-tick as price develops, which is standard real-time behavior, not repainting. Once a bar closes, all curve values on that bar are permanent. The hybrid architecture (backfit polyline for known history, plot() for unlimited real-time range, projection polyline for controlled forward extension) prevents overflow errors while maintaining non-repainting integrity across all components.
🗒️ NOTES 🗒️
The indicator renders curves based on any anchor points provided without validation. Unusual anchor placement produces mathematically accurate but potentially non-useful results. Adjustment is iterative—if the curve doesn't match expectations, reposition the anchors.
Because anchor points are stored as specific time and price coordinates, a new instance of the indicator should be added when analyzing a different chart or timeframe.
Grip handles can be hidden by setting Grip Size to zero in the settings. This is useful for clean chart screenshots or presentations where interactive elements are not needed.
Projection length can be set to zero if forward-looking curves are not desired. The indicator will still render the backfit curves through the anchor points and continue plotting in real-time without the dotted projection extensions.
Anchor points remain fixed at their selected time-price coordinates as new bars form. The curves extend forward automatically from these historical anchors, allowing observation of how projected trajectories align with developing price action.
⚠️ DISCLAIMER ⚠️
The Flexible S/R Channels indicator is a visual analysis tool designed to illustrate geometric market inertia and serve as a framework for understanding dynamic support and resistance. While the indicator generates structural channels and projected paths, no guarantee is made regarding the accuracy or profitability of these projections. Like all technical indicators, the curves and boundaries generated by this tool may appear to align with favorable trading opportunities in hindsight. However, these visualizations are not intended as standalone recommendations for trading decisions. This indicator is intended for educational and analytical purposes, complementing other tools and methods of market analysis.
🧠 BEYOND THE CODE 🧠
Flexible S/R Channels is part of a broader collection of tools designed to provide structured market analysis. This includes the Grid Bot Simulator , the Grid Bot Auto , the Grid Bot Parabolic , and the Gridbot Ping Pong . While each tool serves a distinct purpose, they all utilize dynamic anchor mechanics and non-linear boundaries to adapt to evolving market conditions.
This indicator shares the same educational philosophy as the Fibonacci Time-Price Zones and the Fibonacci Geometry Series - providing frameworks for understanding market concepts through visualization and experimentation rather than black-box signals.
The Flexible S/R Channels indicator, like other xxattaxx indicators , is designed to encourage both education and community engagement. Feedback and insights are invaluable to refining and enhancing this tool. We look forward to the creative applications, observations, and discussions this indicator inspires within the trading community.

Photon Price Action Scanner [JOAT]Photon Price Action Scanner - Multi-Pattern Recognition with Adaptive Filtering
Introduction and Purpose
Photon Price Action Scanner is an open-source overlay indicator that automates the detection of 15+ candlestick patterns while filtering them through multiple confirmation layers. The core problem this indicator solves is pattern noise: raw candlestick pattern detection produces too many signals, most of which fail because they lack context. This indicator addresses that by combining pattern recognition with trend alignment, volume-weighted strength scoring, velocity confirmation, and an adaptive neural bias filter.
The combination of these components is not arbitrary. Each filter addresses a specific weakness in standalone pattern detection:
Trend alignment ensures patterns appear in favorable market structure
Volume-weighted strength filters out weak patterns with low conviction
Velocity confirmation identifies momentum behind the pattern
Neural bias filter adapts to recent price behavior to avoid counter-trend signals
What Makes This Indicator Original
While candlestick pattern scanners exist, this indicator's originality comes from:
1. Multi-Layer Filtering System - Patterns must pass through trend, strength, velocity, and neural bias filters before generating signals. This dramatically reduces false positives compared to simple pattern detection.
2. Adaptive Neural Bias Filter - A custom momentum-adjusted EMA that learns from recent price action using a configurable learning rate. This is not a standard moving average but an adaptive filter that accelerates during trends and smooths during consolidation.
3. Pattern Strength Scoring - Each pattern receives a strength score based on volume ratio and body size, allowing traders to focus on high-conviction setups rather than every pattern occurrence.
4. Smart Cooldown System - Prevents signal overlap by enforcing minimum bar spacing between pattern labels, keeping charts clean even when "Show All Patterns" is enabled.
How the Components Work Together
Step 1: Pattern Detection
The indicator scans for 15 candlestick patterns using precise mathematical definitions:
// Example: Bullish Engulfing requires the current bullish candle to completely
// engulf the previous bearish candle with a larger body
isBullishEngulfing() =>
bool pattern = close < open and close > open and
open <= close and close >= open and
close - open > open - close
pattern
// Example: Three White Soldiers requires three consecutive bullish candles
// with each opening within the previous body and closing higher
isThreeWhiteSoldiers() =>
bool pattern = close > open and close > open and close > open and
close < close and close < close and
open > open and open < close and
open > open and open < close
pattern
Step 2: Strength Calculation
Each detected pattern receives a strength score combining volume and body size:
float volRatio = avgVolume > 0 ? volume / avgVolume : 1.0
float bodySize = math.abs(close - open) / close
float baseStrength = (volRatio + bodySize * 100) / 2
This ensures patterns with above-average volume and large bodies score higher than weak patterns on low volume.
Step 3: Trend Alignment
Patterns are checked against the trend direction using an EMA:
float trendEMA = ta.ema(close, i_trendPeriod)
int trendDir = close > trendEMA ? 1 : close < trendEMA ? -1 : 0
Bullish patterns in uptrends and bearish patterns in downtrends receive priority.
Step 4: Neural Bias Filter
The adaptive filter uses a momentum-adjusted EMA that responds to price changes:
neuralEMA(series float src, simple int period, simple float lr) =>
var float neuralValue = na
var float momentum = 0.0
if na(neuralValue)
neuralValue := src
float error = src - neuralValue
float adjustment = error * lr
momentum := momentum * 0.9 + adjustment * 0.1
neuralValue := neuralValue + adjustment + momentum
neuralValue
The learning rate (lr) controls how quickly the filter adapts. Higher values make it more responsive; lower values make it smoother.
Step 5: Velocity Confirmation
Price velocity (rate of change) must exceed the average velocity for strong signals:
float velocity = ta.roc(close, i_trendPeriod)
float avgVelocity = ta.sma(velocity, i_trendPeriod)
bool velocityBull = velocity > avgVelocity * 1.5
Step 6: Signal Classification
Signals are classified based on how many filters they pass:
Strong Pattern : Pattern + strength threshold + trend alignment + neural bias + velocity
Ultra Pattern : Strong pattern + gap in same direction + velocity confirmation
Watch Pattern : Pattern detected but not all filters passed
Detected Patterns
Classic Reversal Patterns:
Bullish/Bearish Engulfing - Complete body engulfment with larger body
Hammer - Long lower wick (2x body), small upper wick, bullish context
Shooting Star - Long upper wick (2x body), small lower wick, bearish context
Morning Star - Three-bar bullish reversal with small middle body
Evening Star - Three-bar bearish reversal with small middle body
Piercing Line - Bullish candle closing above midpoint of previous bearish candle
Dark Cloud Cover - Bearish candle closing below midpoint of previous bullish candle
Bullish/Bearish Harami - Small body contained within previous larger body
Doji - Body less than 10% of total range (indecision)
Advanced Patterns (Optional):
Three White Soldiers - Three consecutive bullish candles with rising closes
Three Black Crows - Three consecutive bearish candles with falling closes
Tweezer Top - Equal highs with reversal candle structure
Tweezer Bottom - Equal lows with reversal candle structure
Island Reversal - Gap isolation creating reversal structure
Dashboard Information
The dashboard displays real-time analysis:
Pattern - Current detected pattern name or "SCANNING..."
Bull/Bear Strength - Volume-weighted strength scores
Trend - UPTREND, DOWNTREND, or SIDEWAYS based on EMA
RSI - 14-period RSI for momentum context
Momentum - 10-period momentum reading
Volatility - ATR as percentage of price
Neural Bias - BULLISH, BEARISH, or NEUTRAL from adaptive filter
Action - ULTRA BUY/SELL, BUY/SELL, WATCH BUY/SELL, or WAIT
Visual Elements
Pattern Labels - Abbreviated codes (BE=Engulfing, H=Hammer, MS=Morning Star, etc.)
Neural Bias Line - Adaptive trend line showing filter direction
Gap Boxes - Cyan boxes highlighting price gaps
Action Zones - Dashed boxes around strong pattern areas
Velocity Markers - Small circles when velocity confirms direction
Ultra Signals - Large labels for highest conviction setups
How to Use This Indicator
For Reversal Trading:
1. Wait for a pattern to appear at a key support/resistance level
2. Check that the Action shows "BUY" or "SELL" (not just "WATCH")
3. Confirm the Neural Bias aligns with your trade direction
4. Use the strength score to gauge conviction (higher is better)
For Trend Continuation:
1. Identify the trend using the Trend row in the dashboard
2. Look for patterns that align with the trend (bullish patterns in uptrends)
3. Ultra signals indicate the strongest continuation setups
For Filtering Noise:
1. Keep "Show All Patterns" disabled to see only filtered signals
2. Increase "Pattern Strength Filter" to see fewer, higher-quality patterns
3. Enable "Velocity Confirmation" to require momentum behind patterns
Input Parameters
Scan Sensitivity (1.0) - Overall detection sensitivity multiplier
Pattern Strength Filter (3) - Minimum strength score for strong signals
Trend Period (20) - EMA period for trend determination
Show All Patterns (false) - Display all patterns regardless of filters
Advanced Patterns (true) - Enable soldiers/crows/tweezer detection
Gap Analysis (true) - Enable gap detection and boxes
Velocity Confirmation (true) - Require velocity for strong signals
Neural Bias Filter (true) - Enable adaptive trend filter
Neural Period (50) - Lookback for neural bias calculation
Neural Learning Rate (0.12) - Adaptation speed (0.01-0.5)
Timeframe Recommendations
1H-4H: Best balance of signal frequency and reliability
Daily: Fewer but more significant patterns
15m-30m: More signals, requires tighter filtering (increase strength threshold)
Limitations
Pattern detection is mechanical and does not consider fundamental context
Neural bias filter may lag during rapid trend reversals
Gap detection requires clean price data without after-hours gaps
Strength scoring favors high-volume patterns, which may miss valid low-volume setups
- Made with passion by officialjackofalltrades

SMC Post-Analysis Lab [PhenLabs]📊 SMC Post-Analysis Lab
Version: PineScript™ v6
📌 Description
The SMC Post-Analysis Lab is a dedicated hindsight analysis tool built for traders who want to understand what really happened during any historical trading period. Unlike forward-looking indicators, this tool lets you scroll back through time and instantly receive algorithmic classification of market states using Smart Money Concepts methodology.
Whether you’re reviewing a losing trade, studying a successful session, or building your pattern recognition skills, this indicator provides immediate context. The expansion-aware algorithm processes price action within your selected window and outputs clear, actionable classifications ranging from Parabolic Expansion to Consolidation Inducements.
Stop relying on subjective post-trade analysis. Let the algorithm objectively tell you whether institutional players were accumulating, distributing, or running inducements during your trades.
🚀 Points of Innovation
First indicator specifically designed for SMC-based post-trade review rather than live signal generation
Dual-mode analysis system allowing both dynamic scrollback and precise date selection
Expansion-aware classification algorithm that weighs range position against net displacement
Real-time efficiency metrics calculating directional quality of price movement
Integrated visual FVG detection within the analysis window only
Interactive table with clickable date range adjustment via chart interface
🔧 Core Components
Pivot Detection Engine: Uses configurable pivot length to identify significant swing highs and lows for structure break detection
Window Calculator: Determines active analysis zone based on either bar offset or timestamp boundaries
Data Aggregator: Tracks window open, high, low, close and counts bullish/bearish structure break events
State Classification Algorithm: Applies hierarchical logic to determine market state from six possible classifications
Visual Renderer: Draws structure breaks, FVG boxes, and window highlighting within the active zone
🔥 Key Features
Sliding Window Mode: Use the Scroll Back slider to dynamically move your analysis zone backwards through history bar-by-bar
Date Range Mode: Select specific start and end timestamps for precise session or trade review
Six Market State Classifications: Parabolic Expansion (Bull/Bear), Bullish/Bearish Order Flow, Accumulation/Distribution Reversal, and Consolidation/Inducement
Range Position Percentile: See exactly where price closed relative to the window’s high-low range as a percentage
Bull/Bear Event Counter: Quantified count of structure breaks in each direction during the analysis period
Efficiency Calculation: Net move divided by total range reveals trending quality versus chop
🎨 Visualization
Blue Window Highlight: Active analysis zone is clearly marked with blue background shading on the chart
Structure Break Lines: Dashed lines appear at each bullish or bearish structure break within the window
FVG Boxes: Fair Value Gaps automatically render as semi-transparent boxes in bullish or bearish colors
Dashboard Table: Top-right positioned table displays State, Analysis description, and Metrics in real-time
Color-Coded States: Each classification uses distinct coloring for immediate visual recognition
Interactive Tip Row: Optional help text guides users on clicking the table to adjust date range
📖 Usage Guidelines
General Configuration
Analysis Mode: Default is Sliding Window. Choose Date Range for specific timestamp analysis.
Sliding Window Settings
Scroll Back (Bars): Default 0. Increase to move window backwards into history.
Window Width (Bars): Default 100. Range 20-50 for scalping, 100+ for swing analysis.
Date Range Settings
Start Date: Select the beginning timestamp for your analysis period.
End Date: Select the ending timestamp for your analysis period.
Visual Settings
Show Help Tip: Default true. Toggle to hide instructional row in dashboard.
Bullish Color: Default teal. Customize for bullish elements.
Bearish Color: Default red. Customize for bearish elements.
SMC Parameters
Pivot Length: Default 5. Lower values (3-5) catch minor breaks. Higher values (10+) focus on major swings.
✅ Best Use Cases
Post-trade review to understand why entries succeeded or failed
Session analysis to identify institutional activity patterns
Trade journaling with objective algorithmic classifications
Pattern recognition training through historical scrollback
Identifying whether stop hunts were inducements or legitimate breaks
Comparing your real-time read versus what the algorithm detected
⚠️ Limitations
Designed for historical analysis only, not live trade signals
Classification accuracy depends on appropriate pivot length for the timeframe
FVG detection uses simple gap logic without mitigation tracking
State classification is based on window data only, not broader context
Requires manual scrolling or date input to review different periods
💡 What Makes This Unique
Purpose-Built for Review: Unlike most indicators focused on live signals, this is designed specifically for post-trade analysis
Expansion-Aware Logic: Algorithm weighs both position in range AND directional efficiency for accurate state detection
Interactive Date Control: Click the dashboard table to reveal draggable anchors for window adjustment directly on chart
🔬 How It Works
1. Window Definition:
User selects either Sliding Window or Date Range mode
System calculates which bars fall within the active analysis zone
Active zone receives blue background highlighting
2. Data Collection:
Algorithm captures window open, running high, running low, and current close
Structure breaks are detected when price crosses above last pivot high or below last pivot low
Bullish and bearish events are counted separately
3. State Classification:
Range Position calculates where close sits as percentage of high-low range
Efficiency calculates net move divided by total range
Hierarchical logic applies priority rules from Parabolic states down to Consolidation
4. Output Rendering:
Dashboard table updates with State title, Analysis description, and Metrics
Visual elements render within window only to keep chart clean
Colors reflect bullish, bearish, or neutral classification
💡 Note:
This indicator is intended for educational and review purposes. Use it to develop your understanding of Smart Money Concepts by analyzing what institutional order flow looked like during historical periods. Combine insights with your own analysis methodology for best results.

chart Pattern & Candle sticks Strategy# **XAUUSD Pattern & Candle Strategy - Complete Description**
## **Overview**
This Pine Script indicator is a comprehensive multi-factor trading system specifically designed for **XAUUSD (Gold) scalping and swing trading**. It combines classical technical analysis methods including candlestick patterns, chart patterns, moving averages, and volume analysis to generate high-probability buy/sell signals with automatic stop-loss and take-profit levels.
***
## **Core Components**
### **1. Moving Average System (Triple MA)**
**Purpose:** Identifies trend direction and momentum
- **Fast MA (20-period)** - Short-term price action
- **Medium MA (50-period)** - Intermediate trend
- **Slow MA (200-period)** - Long-term trend direction
**How it works:**
- **Bullish alignment**: MA20 > MA50 > MA200 (all pointing up)
- **Bearish alignment**: MA20 < MA50 < MA200 (all pointing down)
- **Crossover signals**: When Fast MA crosses Medium MA, it triggers buy/sell signals
- **Choice of SMA or EMA**: Adjustable based on preference
**Visual indicators:**
- Blue line = Fast MA
- Orange line = Medium MA
- Light red line = Slow MA
- Green background tint = Bullish trend
- Red background tint = Bearish trend
---
### **2. Candlestick Pattern Recognition (13 Patterns)**
**Purpose:** Identifies reversal and continuation signals based on price action
#### **Bullish Patterns (Signal potential upward moves):**
1. **Hammer** 🔨
- Long lower wick (2x body size)
- Small body at top
- Indicates rejection of lower prices (buyers stepping in)
- Best at support levels
2. **Inverted Hammer**
- Long upper wick
- Small body at bottom
- Shows buying pressure despite initial selling
3. **Bullish Engulfing** 📈
- Green candle completely engulfs previous red candle
- Strong reversal signal
- Body must be 1.2x larger than previous
4. **Morning Star** ⭐
- 3-candle pattern
- Red candle → Small indecision candle → Large green candle
- Powerful reversal at bottoms
5. **Piercing Line** ⚡
- Green candle closes above 50% of previous red candle
- Indicates strong buying interest
6. **Bullish Marubozu**
- Almost no wicks (95% body)
- Very strong bullish momentum
- Body must be 1.3x average size
#### **Bearish Patterns (Signal potential downward moves):**
7. **Shooting Star** 💫
- Long upper wick
- Small body at bottom
- Indicates rejection of higher prices (sellers in control)
- Best at resistance levels
8. **Hanging Man**
- Similar to hammer but appears at top
- Warning of potential reversal down
9. **Bearish Engulfing** 📉
- Red candle completely engulfs previous green candle
- Strong reversal signal
10. **Evening Star** 🌙
- 3-candle pattern (opposite of Morning Star)
- Green → Small → Large red candle
- Powerful top reversal
11. **Dark Cloud Cover** ☁️
- Red candle closes below 50% of previous green candle
- Indicates strong selling pressure
12. **Bearish Marubozu**
- Almost no wicks, pure red body
- Very strong bearish momentum
#### **Neutral Pattern:**
13. **Doji**
- Open and close nearly equal (tiny body)
- Indicates indecision
- Often precedes major moves
**Detection Logic:**
- Compares body size, wick ratios, and position relative to previous candles
- Uses 14-period average body size as reference
- All patterns validated against volume confirmation
***
### **3. Chart Pattern Recognition**
**Purpose:** Identifies major support/resistance and reversal patterns
#### **Patterns Detected:**
**Double Bottom** 📊 (Bullish)
- Two lows at approximately same level
- Indicates strong support
- Breakout above neckline triggers buy signal
- Most reliable at major support zones
**Double Top** 📊 (Bearish)
- Two highs at approximately same level
- Indicates strong resistance
- Breakdown below neckline triggers sell signal
- Most reliable at major resistance zones
**Support & Resistance Levels**
- Automatically plots recent pivot highs (resistance)
- Automatically plots recent pivot lows (support)
- Uses 3-bar strength for validation
- Levels shown as dashed horizontal lines
**Price Action Patterns**
- **Uptrend detection**: Higher highs + higher lows
- **Downtrend detection**: Lower highs + lower lows
- Confirms overall market structure
***
### **4. Volume Analysis**
**Purpose:** Confirms signal strength and filters false signals
**Metrics tracked:**
- **Volume MA (20-period)**: Baseline average volume
- **High volume threshold**: 1.5x the volume average
- **Volume increase**: Current volume > previous 2 bars
**How it's used:**
- All buy/sell signals **require volume confirmation**
- High volume = institutional participation
- Low volume signals are filtered out
- Prevents whipsaw trades during quiet periods
**Visual indicator:**
- Dashboard shows "High" volume in orange when active
- "Normal" shown in gray during low volume
***
### **5. Signal Generation Logic**
**BUY SIGNALS triggered when ANY of these occur:**
1. **Candlestick + Volume**
- Bullish candle pattern detected
- High volume confirmation
- Price above Fast MA
2. **MA Crossover + Volume**
- Fast MA crosses above Medium MA
- High volume confirmation
3. **Double Bottom Breakout**
- Price breaks above support level
- Volume confirmation present
4. **Trend Continuation**
- Uptrend structure intact (higher highs/lows)
- All MAs in bullish alignment
- Price above Fast MA
- Volume confirmation
**SELL SIGNALS triggered when ANY of these occur:**
1. **Candlestick + Volume**
- Bearish candle pattern detected
- High volume confirmation
- Price below Fast MA
2. **MA Crossunder + Volume**
- Fast MA crosses below Medium MA
- High volume confirmation
3. **Double Top Breakdown**
- Price breaks below resistance level
- Volume confirmation present
4. **Trend Continuation**
- Downtrend structure intact (lower highs/lows)
- All MAs in bearish alignment
- Price below Fast MA
- Volume confirmation
***
### **6. Risk Management System**
**Automatic Stop Loss Calculation:**
- Based on ATR (Average True Range) - 14 periods
- **Formula**: Entry price ± (ATR × SL Multiplier)
- **Default multiplier**: 1.5 (adjustable)
- Adapts to market volatility automatically
**Automatic Take Profit Calculation:**
- **Formula**: Entry price ± (ATR × TP Multiplier)
- **Default multiplier**: 2.5 (adjustable)
- **Default Risk:Reward ratio**: 1:1.67
- Higher TP multiplier = more aggressive targets
**Position Management:**
- Tracks ONE position at a time (no pyramiding)
- Automatically closes position when:
- Stop loss is hit
- Take profit is reached
- Opposite MA crossover occurs
- Prevents revenge trading and over-leveraging
**Visual Representation:**
- **Red horizontal line** = Stop Loss level
- **Green horizontal line** = Take Profit level
- Lines remain on chart while position is active
- Automatically disappear when position closes
***
### **7. Visual Elements**
**On-Chart Displays:**
1. **Moving Average Lines**
- Fast MA (Blue, thick)
- Medium MA (Orange, thick)
- Slow MA (Red, thin)
2. **Support/Resistance**
- Green crosses = Support levels
- Red crosses = Resistance levels
3. **Buy/Sell Arrows**
- Large GREEN "BUY" label below bars
- Large RED "SELL" label above bars
4. **Pattern Labels** (Small markers)
- "Hammer", "Bull Engulf", "Morning Star" (green, below bars)
- "Shooting Star", "Bear Engulf", "Evening Star" (red, above bars)
- "Double Bottom" / "Double Top" (blue/orange)
5. **Signal Detail Labels** (Medium size)
- Shows signal reason (e.g., "Bullish Candle", "MA Cross Up")
- Displays Entry, SL, and TP prices
- Color-coded (green for long, red for short)
6. **Background Coloring**
- Light green tint = Bullish MA alignment
- Light red tint = Bearish MA alignment
***
### **8. Information Dashboard**
**Top-right corner table showing:**
| Metric | Description |
|--------|-------------|
| **Position** | Current trade status (LONG/SHORT/None) |
| **MA Trend** | Overall trend direction (Bullish/Bearish/Neutral) |
| **Volume** | Current volume status (High/Normal) |
| **Pattern** | Last detected candlestick pattern |
| **ATR** | Current volatility measurement |
**Purpose:**
- Quick at-a-glance market assessment
- Real-time position tracking
- No need to check multiple indicators
***
### **9. Alert System**
**Complete alert coverage for:**
✅ **Entry Alerts**
- "Buy Signal" - Triggers when buy conditions met
- "Sell Signal" - Triggers when sell conditions met
✅ **Exit Alerts**
- "Long TP Hit" - Take profit reached on long position
- "Long SL Hit" - Stop loss triggered on long position
- "Short TP Hit" - Take profit reached on short position
- "Short SL Hit" - Stop loss triggered on short position
**How to use:**
1. Click "Create Alert" button
2. Select desired alert from dropdown
3. Set notification method (popup, email, SMS, webhook)
4. Never miss a trade opportunity
***
## **Recommended Settings**
### **For Scalping (Quick trades):**
- **Timeframe**: 5-minute
- **Fast MA**: 9
- **Medium MA**: 21
- **Slow MA**: 50
- **SL Multiplier**: 1.0
- **TP Multiplier**: 2.0
- **Volume Threshold**: 1.5x
### **For Swing Trading (Longer holds):**
- **Timeframe**: 1-hour or 4-hour
- **Fast MA**: 20
- **Medium MA**: 50
- **Slow MA**: 200
- **SL Multiplier**: 2.0
- **TP Multiplier**: 3.0
- **Volume Threshold**: 1.3x
### **Best Trading Hours for XAUUSD:**
- **Asian Session**: 00:00 - 08:00 GMT (lower volatility)
- **London Session**: 08:00 - 16:00 GMT (high volatility) ⭐
- **New York Session**: 13:00 - 21:00 GMT (highest volume) ⭐
- **London-NY Overlap**: 13:00 - 16:00 GMT (BEST for scalping) 🔥
***
## **How to Use This Strategy**
### **Step 1: Setup**
1. Open TradingView
2. Load XAUUSD chart
3. Select timeframe (5m, 15m, 1H, or 4H)
4. Add indicator from Pine Editor
5. Adjust settings based on your trading style
### **Step 2: Wait for Signals**
- Watch for GREEN "BUY" or RED "SELL" labels
- Check the signal reason in the detail label
- Verify dashboard shows favorable conditions
- Confirm volume is "High" (not required but preferred)
### **Step 3: Enter Trade**
- Enter at market or limit order near signal price
- Note the displayed Entry, SL, and TP prices
- Set your broker's SL/TP to match indicator levels
### **Step 4: Manage Position**
- Watch for SL/TP lines on chart
- Monitor dashboard for trend changes
- Exit manually if opposite MA crossover occurs
- Let SL/TP do their job (don't move them!)
### **Step 5: Review & Learn**
- Track win rate over 20+ trades
- Adjust multipliers if needed
- Note which patterns work best for you
- Refine entry timing
***
## **Key Advantages**
✅ **Multi-confirmation approach** - Reduces false signals significantly
✅ **Automatic risk management** - No manual calculation needed
✅ **Adapts to volatility** - ATR-based SL/TP adjusts to market conditions
✅ **Volume filtered** - Ensures institutional participation
✅ **Visual clarity** - Easy to understand at a glance
✅ **Complete alert system** - Never miss opportunities
✅ **Pattern education** - Learn patterns as they appear
✅ **Works on all timeframes** - Scalping to swing trading
***
## **Limitations & Considerations**
⚠️ **Not a holy grail** - No strategy wins 100% of trades
⚠️ **Requires practice** - Demo trade first to understand signals
⚠️ **Market conditions matter** - Works best in trending or volatile markets
⚠️ **News events** - Avoid trading during major economic releases
⚠️ **Slippage on 5m** - Fast markets may have execution delays
⚠️ **Pattern subjectivity** - Some patterns may trigger differently than expected
***
## **Risk Management Rules**
1. **Never risk more than 1-2% per trade**
2. **Maximum 3 positions per day** (avoid overtrading)
3. **Don't trade during major news** (NFP, FOMC, etc.)
4. **Use proper position sizing** (0.01 lot per $100 for micro accounts)
5. **Keep trade journal** (track patterns, win rate, mistakes)
6. **Stop trading after 3 consecutive losses** (psychological reset)
7. **Don't move stop loss further away** (accept losses)
8. **Take partial profits** at 1:1 R:R if desired
***
## **Expected Performance**
**Realistic expectations:**
- **Win rate**: 50-65% (depending on market conditions and timeframe)
- **Risk:Reward**: 1:1.67 default (adjustable to 1:2 or 1:3)
- **Signals per day**: 3-8 on 5m, 1-3 on 1H
- **Best months**: High volatility periods (news events, economic uncertainty)
- **Drawdowns**: Expect 3-5 losing trades in a row occasionally
***
## **Customization Options**
All inputs are adjustable in settings panel:
**Moving Averages:**
- Type (SMA or EMA)
- All three period lengths
**Volume:**
- Volume MA length
- High volume multiplier threshold
**Chart Patterns:**
- Pattern strength (bars for pivot detection)
- Show/hide pattern labels
**Risk Management:**
- ATR period
- Stop loss multiplier
- Take profit multiplier
**Display:**
- Toggle pattern labels
- Customize colors (in code)
***
## **Conclusion**
This is a **professional-grade, multi-factor trading system** that combines the best of classical technical analysis with modern risk management. It's designed to give clear, actionable signals while automatically handling the complex calculations of stop loss and take profit levels.
**Best suited for traders who:**
- Understand basic technical analysis
- Can follow rules consistently
- Prefer systematic approach over gut feeling
- Want visual confirmation before entering trades
- Value proper risk management
**Start with demo trading** for at least 20-30 trades to understand how the signals work in different market conditions. Once comfortable and profitable on demo, transition to live trading with minimal risk per trade.
Happy trading! 📈🎯

MTF Levels [OmegaTools]📖 Introduction
The Ω Levels Indicator is a complete market structure and level-mapping framework designed to help traders identify key zones where price is likely to react.
It blends classic technical anchors (VWAP, pivots, means, standard deviations) with modern statistical pattern recognition to dynamically project areas of manipulation, extension, and equilibrium.
At its core, Ω Levels creates an evolving map of market balance vs. imbalance, showing traders where liquidity is most likely to build and where price could pivot or accelerate.
But what makes it truly unique is the Pivot Forecaster — an embedded predictive engine that applies machine-learning inspired logic to recognize conditions that historically precede market turning points.
🔎 Key Features
Customizable Levels Framework
Define up to three levels (manipulation, extensions, VWAP, pivots, stdev bands, or prior extremes).
Choose mean references such as Open, VWAP, Pivot Mean, or Previous Session Mean.
Style controls (solid, dotted, dashed) and fill modes (internal, external, ranges) allow you to adapt the chart to your visual workflow.
Dynamic Zone Highlighting
Automatic fills between internal/external levels, or between specific level pairs (1–2, 1–3, 2–3).
Makes it easy to visualize value areas, expansions, and compression zones at a glance.
Multi-Timeframe Anchoring
Works on any timeframe, but calculations can be anchored to a higher timeframe (e.g., show daily VWAP & pivots on a 15m chart).
This allows traders to align intraday execution with higher timeframe context.
Pivot Forecaster (Machine Learning / Pattern Recognition)
This is the advanced predictive component.
The algorithm collects historical conditions observed around pivot highs and lows (volume state, ATR state, % candle expansion, oscillator conditions).
It then builds statistical “profiles” of typical pivot behavior and compares them in real-time against current market conditions.
When conditions match the “signature” of a pivot, the indicator highlights a Forecast Pivot High or Forecast Pivot Low (displayed as small diamond markers).
This functions as a pattern-recognition system, effectively learning from past pivots to anticipate where the next turning point is more likely to occur.
⚡ How Traders Can Use It
Intraday Execution: Use VWAP, manipulation, and extension levels to frame trades around liquidity zones.
Swing Context: Overlay higher timeframe pivots and means to guide medium-term positioning.
Fade Setups: Forecasted pivots often coincide with exhaustion zones where fading momentum carries edge.
Breakout Validation: When price breaks a structural level but the forecaster does not confirm a pivot, continuation probability is higher.
Risk Management: Levels provide natural stop/target placements, while pivot forecasts serve as warning signals for potential reversals.
⚙️ Settings Overview
Timeframe: Choose the anchor timeframe for calculations (default: Daily).
Means: Two selectable mean references (Open, VWAP, Pivot Point, Previous Mean).
Levels: Three levels can be customized (Manipulation, Extension, 1–2 StDev, Pivot Point, VWAP, Previous Extremes).
Fill Modes: Highlight zones between internal/external levels or custom ranges.
Visual Customization: Colors, line styles, fill opacity, and toggle for old levels.
Pivot Forecaster: Fully automated — no settings required, it adapts to instrument and timeframe.
🧭 Best Practices
Align Levels With Market Profile: Treat the levels as dynamic S/R zones and watch how price interacts with them.
Use Forecaster as Confirmation: The diamonds are not standalone signals; they are context filters that help you decide whether a move has higher reversal odds.
Higher Timeframe Anchoring: On intraday charts, set the timeframe to Daily or Weekly to trade with institutional levels.
Combine With ATR: Pair with the Ω ATR Indicator to size positions according to volatility while Ω Levels provides the structural roadmap.
📌 Summary
The Ω Levels Indicator is more than a level plotter — it’s a market map + predictive engine.
By combining traditional levels with an intelligent pivot forecaster, it gives traders both the static structure of where price should react, and the dynamic signal of where it is likely to react next.
This dual-layer approach — structural + predictive — makes it an invaluable tool for discretionary intraday traders, swing traders, and anyone who wants to anticipate price behavior instead of just reacting to it.

Smart Money Precision Structure [BullByte]Smart Money Precision Structure
Advanced Market Structure Analysis Using Institutional Order Flow Concepts
---
OVERVIEW
Smart Money Precision Structure (SMPS) is a comprehensive market analysis indicator that combines six analytical frameworks to identify high-probability market structure patterns. The indicator uses multi-dimensional scoring algorithms to evaluate market conditions through institutional order flow concepts, providing traders with professional-grade market analysis.
---
PURPOSE AND ORIGINALITY
Why This Indicator Was Developed
• Addresses the gap between retail and institutional analysis methods
• Consolidates multiple analysis techniques that professionals use separately
• Automates complex market structure evaluation into actionable insights
• Eliminates the need for multiple indicators by providing comprehensive analysis
What Makes SMPS Original
• Six-Layer Confluence System - Unique combination of market regime, structure, volume flow, momentum, price action, and adaptive filtering
• Institutional Pattern Recognition - Identifies smart money accumulation and distribution patterns
• Adaptive Intelligence - Parameters automatically adjust based on detected market conditions
• Real-Time Market Scoring - Proprietary algorithm rates market quality from 0-100%
• Structure Break Detection - Advanced pivot analysis identifies trend reversals early
---
HOW IT WORKS - TECHNICAL METHODOLOGY
1. Market Regime Analysis Engine
The indicator evaluates five core market dimensions:
• Volatility Score - Measures current volatility against 50-period historical baseline
• Trend Score - Analyzes alignment between 8, 21, and 50-period EMAs
• Momentum Score - Combines RSI divergence with MACD signal alignment
• Structure Score - Evaluates pivot point formation clarity
• Efficiency Score - Calculates directional movement efficiency ratio
These scores combine to classify markets into five regimes:
• TRENDING - Strong directional movement with aligned indicators
• RANGING - Sideways movement with mixed directional signals
• VOLATILE - Elevated volatility with unpredictable price swings
• QUIET - Low volatility consolidation periods
• TRANSITIONAL - Market shifting between different regimes
2. Market Structure Analysis
Advanced pivot point analysis identifies:
• Higher Highs and Higher Lows for bullish structure
• Lower Highs and Lower Lows for bearish structure
• Structure breaks when established patterns fail
• Dynamic support and resistance from recent pivot points
• Key level proximity detection using ATR-based buffers
3. Volume Flow Decoding
Institutional activity detection through:
• Volume surge identification when volume exceeds 2x average
• Buy versus sell pressure analysis using price-volume correlation
• Flow strength measurement through directional volume consistency
• Divergence detection between volume and price movements
• Institutional threshold alerts when unusual volume patterns emerge
4. Multi-Period Momentum Synthesis
Weighted momentum calculation across four timeframes:
• 1-period momentum weighted at 40%
• 3-period momentum weighted at 30%
• 5-period momentum weighted at 20%
• 8-period momentum weighted at 10%
Result smoothed with 6-period EMA for noise reduction.
5. Price Action Quality Assessment
Each bar evaluated for:
• Range quality relative to 20-period average
• Body-to-range ratio for directional conviction
• Wick analysis for rejection pattern identification
• Pattern recognition including engulfing and hammer formations
• Sequential price movement analysis
6. Adaptive Parameter System
Parameters automatically adjust based on detected regime:
• Trending markets reduce sensitivity and confirmation requirements
• Volatile markets increase filtering and require additional confirmations
• Ranging markets maintain neutral settings
• Transitional markets use moderate adjustments
---
COMPLETE SETTINGS GUIDE
Section 1: Core Analysis Settings
Analysis Sensitivity (0.3-2.0)
• Default: 1.0
• Lower values require stronger price movements
• Higher values detect more subtle patterns
• Scalpers use 0.8-1.2, swing traders use 1.5-2.0
Noise Reduction Level (2-7)
• Default: 4
• Controls filtering of false patterns
• Higher values reduce pattern frequency
• Increase in volatile markets
Minimum Move % (0.05-0.50)
• Default: 0.15%
• Sets minimum price movement threshold
• Adjust based on instrument volatility
• Forex: 0.05-0.10%, Stocks: 0.15-0.25%, Crypto: 0.20-0.50%
High Confirmation Mode
• Default: True (Enabled)
• Requires all technical conditions to align
• Reduces frequency but increases reliability
• Disable for more aggressive pattern detection
Section 2: Market Regime Detection
Enable Regime Analysis
• Default: True (Enabled)
• Activates market environment evaluation
• Essential for adaptive features
• Keep enabled for best results
Regime Analysis Period (20-100)
• Default: 50 bars
• Determines regime calculation lookback
• Shorter for responsive, longer for stable
• Scalping: 20-30, Swing: 75-100
Minimum Market Clarity (0.2-0.8)
• Default: 0.4
• Quality threshold for pattern generation
• Higher values require clearer conditions
• Lower for more patterns, higher for quality
Adaptive Parameter Adjustment
• Default: True (Enabled)
• Enables automatic parameter optimization
• Adjusts based on market regime
• Highly recommended to keep enabled
Section 3: Market Structure Analysis
Enable Structure Validation
• Default: True (Enabled)
• Validates patterns against support/resistance
• Confirms trend structure alignment
• Essential for reliability
Structure Analysis Period (15-50)
• Default: 30 bars
• Period for structure pattern analysis
• Affects support/resistance calculation
• Match to your trading timeframe
Minimum Structure Alignment (0.3-0.8)
• Default: 0.5
• Required structure score for valid patterns
• Higher values need stronger structure
• Balance with desired frequency
Section 4: Analysis Configuration
Minimum Strength Level (3-5)
• Default: 4
• Minimum confirmations for pattern display
• 5 = Maximum reliability, 3 = More patterns
• Beginners should use 4-5
Required Technical Confirmations (4-6)
• Default: 5
• Number of aligned technical factors
• Higher = fewer but better patterns
• Works with High Confirmation Mode
Pattern Separation (3-20 bars)
• Default: 8 bars
• Minimum bars between patterns
• Prevents clustering and overtrading
• Increase for cleaner charts
Section 5: Technical Filters
Momentum Validation
• Default: True (Enabled)
• Requires momentum alignment
• Filters counter-trend patterns
• Essential for trend following
Volume Confluence Analysis
• Default: True (Enabled)
• Requires volume confirmation
• Identifies institutional participation
• Critical for reliability
Trend Direction Filter
• Default: True (Enabled)
• Only shows patterns with trend
• Reduces counter-trend signals
• Disable for reversal hunting
Section 6: Volume Flow Analysis
Institutional Activity Threshold (1.2-3.5)
• Default: 2.0
• Multiplier for unusual volume detection
• Lower finds more institutional activity
• Stock: 2.0-2.5, Forex: 1.5-2.0, Crypto: 2.5-3.5
Volume Surge Multiplier (1.8-4.5)
• Default: 2.5
• Defines significant volume increases
• Adjust per instrument characteristics
• Higher for stocks, lower for forex
Volume Flow Period (12-35)
• Default: 18 bars
• Smoothing for volume analysis
• Shorter = responsive, longer = smooth
• Match to timeframe used
Section 7: Analysis Frequency Control
Maximum Analysis Points Per Hour (1-5)
• Default: 3
• Limits pattern frequency
• Prevents overtrading
• Scalpers: 4-5, Swing traders: 1-2
Section 8: Target Level Configuration
Target Calculation Method
• Default: Market Adaptive
• Three modes available:
- Fixed: Uses set point distances
- Dynamic: ATR-based calculations
- Market Adaptive: Structure-based levels
Minimum Target/Risk Ratio (1.0-3.0)
• Default: 1.5
• Minimum acceptable reward vs risk
• Higher filters lower probability setups
• Professional standard: 1.5-2.0
Fixed Mode Settings:
• Fixed Target Distance: 50 points default
• Fixed Invalidation Distance: 30 points default
• Use for consistent instruments
Dynamic Mode Settings:
• Dynamic Target Multiplier: 1.8x ATR default
• Dynamic Invalidation Multiplier: 1.0x ATR default
• Adapts to volatility automatically
Market Adaptive Settings:
• Use Structure Levels: True (default)
• Structure Level Buffer: 0.1% default
• Places levels at actual support/resistance
Section 9: Visual Display Settings
Color Theme Options
• Professional (Teal/Red)
- Bullish: Teal (#26a69a)
- Bearish: Red (#ef5350)
- Neutral: Gray (#78909c)
- Best for: Traditional traders, clean appearance
• Dark (Neon Green/Pink)
- Bullish: Neon Green (#00ff88)
- Bearish: Hot Pink (#ff0044)
- Neutral: Dark Gray (#333333)
- Best for: Dark theme users, high contrast
• Light (Green/Red Classic)
- Bullish: Green (#4caf50)
- Bearish: Red (#f44336)
- Neutral: Light Gray (#9e9e9e)
- Best for: Light backgrounds, traditional colors
• Vibrant (Cyan/Magenta)
- Bullish: Cyan (#00ffff)
- Bearish: Magenta (#ff00ff)
- Neutral: Medium Gray (#888888)
- Best for: High visibility, modern appearance
Dashboard Position
• Options: Top Left, Top Right, Bottom Left, Bottom Right, Middle Left, Middle Right
• Default: Top Right
• Choose based on chart layout preference
Dashboard Size
• Full: Complete information display (desktop)
• Mobile: Compact view for small screens
• Default: Full
Analysis Display Style
• Arrows : Simple directional markers
• Labels : Detailed text information
• Zones : Colored areas showing pattern regions
• Default: Labels (most informative)
Display Options:
• Display Analysis Strength: Shows star rating
• Display Target Levels: Shows target/invalidation lines
• Display Market Regime: Shows regime in pattern labels
---
HOW TO USE SMPS - DETAILED GUIDE
Understanding the Dashboard
Top Row - Header
• SMPS Dashboard title
• VALUE column: Current readings
• STATUS column: Condition assessments
Market Regime Row
• Shows: TRENDING, RANGING, VOLATILE, QUIET, or TRANSITIONAL
• Color coding: Green = Favorable, Red = Caution
• Status: FAVORABLE or CAUTION trading conditions
Market Score Row
• Percentage from 0-100%
• Above 60% = Strong conditions
• 40-60% = Moderate conditions
• Below 40% = Weak conditions
Structure Row
• Direction: BULLISH, BEARISH, or NEUTRAL
• Status: INTACT or BREAK
• Orange BREAK indicates structure failure
Volume Flow Row
• Direction: BUYING or SELLING
• Intensity: STRONG or WEAK
• Color indicates dominant pressure
Momentum Row
• Numerical momentum value
• Positive = Upward pressure
• Negative = Downward pressure
Volume Status Row
• INST = Institutional activity detected
• HIGH = Above average volume
• NORM = Normal volume levels
Adaptive Mode Row
• ACTIVE = Parameters adjusting
• STATIC = Fixed parameters
• Shows required confirmations
Analysis Level Row
• Minimum strength level setting
• Pattern separation in bars
Market State Row
• Current analysis: BULLISH, BEARISH, NEUTRAL
• Shows analysis price level when active
T:R Ratio Row
• Current target to risk ratio
• GOOD = Meets minimum requirement
• LOW = Below minimum threshold
Strength Row
• BULL or BEAR dominance
• Numerical strength value 0-100
Price Row
• Current price
• Percentage change
Last Analysis Row
• Previous pattern direction
• Bars since last pattern
Reading Pattern Signals
Bullish Structure Pattern
• Upward triangle or "Bullish Structure" label
• Star rating shows strength (★★★★★ = strongest)
• Green line = potential target level
• Red dashed line = invalidation level
• Appears below price bars
Bearish Structure Pattern
• Downward triangle or "Bearish Structure" label
• Star rating indicates reliability
• Green line = potential target level
• Red dashed line = invalidation level
• Appears above price bars
Pattern Strength Interpretation
• ★★★★★ = 6 confirmations (exceptional)
• ★★★★☆ = 5 confirmations (strong)
• ★★★☆☆ = 4 confirmations (moderate)
• ★★☆☆☆ = 3 confirmations (minimum)
• Below minimum = filtered out
Visual Elements on Chart
Lines and Levels:
• Gray Line = 21 EMA trend reference
• Green Stepline = Dynamic support level
• Red Stepline = Dynamic resistance level
• Green Solid Line = Active target level
• Red Dashed Line = Active invalidation level
Pattern Markers:
• Triangles = Arrow display mode
• Text Labels = Label display mode
• Colored Boxes = Zone display mode
Target Completion Labels:
• "Target" = Price reached target level
• "Invalid" = Pattern invalidated by price
---
RECOMMENDED USAGE BY TIMEFRAME
1-Minute Charts (Scalping)
• Sensitivity: 0.8-1.2
• Noise Reduction: 3-4
• Pattern Separation: 3-5 bars
• High Confirmation: Optional
• Best for: Quick intraday moves
5-Minute Charts (Precision Intraday)
• Sensitivity: 1.0 (default)
• Noise Reduction: 4 (default)
• Pattern Separation: 8 bars
• High Confirmation: Enabled
• Best for: Day trading
15-Minute Charts (Short Swing)
• Sensitivity: 1.0-1.5
• Noise Reduction: 4-5
• Pattern Separation: 10-12 bars
• High Confirmation: Enabled
• Best for: Intraday swings
30-Minute to 1-Hour (Position Trading)
• Sensitivity: 1.5-2.0
• Noise Reduction: 5-7
• Pattern Separation: 15-20 bars
• Regime Period: 75-100
• Best for: Multi-day positions
Daily Charts (Swing Trading)
• Sensitivity: 1.8-2.0
• Noise Reduction: 6-7
• Pattern Separation: 20 bars
• All filters enabled
• Best for: Long-term analysis
---
MARKET-SPECIFIC SETTINGS
Forex Pairs
• Minimum Move: 0.05-0.10%
• Institutional Threshold: 1.5-2.0
• Volume Surge: 1.8-2.2
• Target Mode: Dynamic or Market Adaptive
Stock Indices (ES, NQ, YM)
• Minimum Move: 0.10-0.15%
• Institutional Threshold: 2.0-2.5
• Volume Surge: 2.5-3.0
• Target Mode: Market Adaptive
Individual Stocks
• Minimum Move: 0.15-0.25%
• Institutional Threshold: 2.0-2.5
• Volume Surge: 2.5-3.5
• Target Mode: Dynamic
Cryptocurrency
• Minimum Move: 0.20-0.50%
• Institutional Threshold: 2.5-3.5
• Volume Surge: 3.0-4.5
• Target Mode: Dynamic
• Increase noise reduction
---
PRACTICAL APPLICATION EXAMPLES
Example 1: Strong Trending Market
Dashboard Reading:
• Market Regime: TRENDING
• Market Score: 75%
• Structure: BULLISH, INTACT
• Volume Flow: BUYING, STRONG
• Momentum: +0.45
Interpretation:
• Strong uptrend environment
• Institutional buying present
• Look for bullish patterns as continuation
• Higher probability of success
• Consider using lower sensitivity
Example 2: Range-Bound Conditions
Dashboard Reading:
• Market Regime: RANGING
• Market Score: 35%
• Structure: NEUTRAL
• Volume Flow: SELLING, WEAK
• Momentum: -0.05
Interpretation:
• No clear direction
• Low opportunity environment
• Patterns are less reliable
• Consider waiting for regime change
• Or switch to a range-trading approach
Example 3: Structure Break Alert
Dashboard Reading:
• Previous: BULLISH structure
• Current: Structure BREAK
• Volume: INST flag active
• Momentum: Shifting negative
Interpretation:
• Trend reversal potentially beginning
• Institutional participation detected
• Watch for bearish pattern confirmation
• Adjust bias accordingly
• Increase caution on long positions
Example 4: Volatile Market
Dashboard Reading:
• Market Regime: VOLATILE
• Market Score: 45%
• Adaptive Mode: ACTIVE
• Confirmations: Increased to 6
Interpretation:
• Choppy conditions
• Parameters auto-adjusted
• Fewer but higher quality patterns
• Wider stops may be needed
• Consider reducing position size
Below are a few chart examples of the Smart Money Precision Structure (SMPS) indicator in action.
• Example 1 – Bullish Structure Detection on SOLUSD 5m
• Example 2 – Bearish Structure Detected with Strong Confluence on SOLUSD 5m
---
TROUBLESHOOTING GUIDE
No Patterns Appearing
Check these settings:
• High Confirmation Mode may be too restrictive
• Minimum Strength Level may be too high
• Market Clarity threshold may be too high
• Regime filter may be blocking patterns
• Try increasing sensitivity
Too Many Patterns
Adjust these settings:
• Enable High Confirmation Mode
• Increase Minimum Strength Level to 5
• Increase Pattern Separation
• Reduce Sensitivity below 1.0
• Enable all technical filters
Dashboard Shows "CAUTION"
This indicates:
• Market conditions are unfavorable
• Regime is RANGING or QUIET
• Market score is low
• Consider waiting for better conditions
• Or adjust expectations accordingly
Patterns Not Reaching Targets
Consider:
• Market may be choppy
• Volatility may have changed
• Try Dynamic target mode
• Reduce target/risk ratio requirement
• Check if regime is VOLATILE
---
ALERTS CONFIGURATION
Alert Message Format
Alerts include:
• Pattern type (Bullish/Bearish)
• Strength rating
• Market regime
• Analysis price level
• Target and invalidation levels
• Strength percentage
• Target/Risk ratio
• Educational disclaimer
Setting Up Alerts
• Click Alert button on TradingView
• Select SMPS indicator
• Choose alert frequency
• Customize message if desired
• Alerts fire on pattern detection
---
DATA WINDOW INFORMATION
The Data Window displays:
• Market Regime Score (0-100)
• Market Structure Bias (-1 to +1)
• Bullish Strength (0-100)
• Bearish Strength (0-100)
• Bull Target/Risk Ratio
• Bear Target/Risk Ratio
• Relative Volume
• Momentum Value
• Volume Flow Strength
• Bull Confirmations Count
• Bear Confirmations Count
---
BEST PRACTICES AND TIPS
For Beginners
• Start with default settings
• Use High Confirmation Mode
• Focus on TRENDING regime only
• Paper trade first
• Learn one timeframe thoroughly
For Intermediate Users
• Experiment with sensitivity settings
• Try different target modes
• Use multiple timeframes
• Combine with price action analysis
• Track pattern success rate
For Advanced Users
• Customize per instrument
• Create setting templates
• Use regime information for bias
• Combine with other indicators
• Develop systematic rules
---
IMPORTANT DISCLAIMERS
• This indicator is for educational and informational purposes only
• Not financial advice or a trading system
• Past performance does not guarantee future results
• Trading involves substantial risk of loss
• Always use appropriate risk management
• Verify patterns with additional analysis
• The author is not a registered investment advisor
• No liability accepted for trading losses
---
VERSION NOTES
Version 1.0.0 - Initial Release
• Six-layer confluence system
• Adaptive parameter technology
• Institutional volume detection
• Market regime classification
• Structure break identification
• Real-time dashboard
• Multiple display modes
• Comprehensive settings
## My Final Thoughts
Smart Money Precision Structure represents an advanced approach to market analysis, bringing institutional-grade techniques to retail traders through intelligent automation and multi-dimensional evaluation. By combining six analytical frameworks with adaptive parameter adjustment, SMPS provides comprehensive market intelligence that single indicators cannot achieve.
The indicator serves as an educational tool for understanding how professional traders analyze markets, while providing practical pattern detection for those seeking to improve their technical analysis. Remember that all trading involves risk, and this tool should be used as part of a complete analysis approach, not as a standalone trading system.
- BullByte

Pattern Detector [theUltimator5]🎯 Overview
The Pattern Detector is a comprehensive technical analysis indicator that automatically identifies and visualizes multiple pattern types on your charts. Built with advanced ZigZag technology and sophisticated pattern recognition algorithms, this tool helps traders spot high-probability trading opportunities across all timeframes and markets.
✨ Key Features
🔍 Multi-Pattern Detection System
Harmonic Patterns: Butterfly, Gartley, Bat, and Crab patterns with precise Fibonacci ratios
Classic Reversal Patterns: Head & Shoulders and Inverse Head & Shoulders
Double Patterns: Double Tops and Double Bottoms with extreme validation
Wedge Patterns: Rising and Falling Wedges with volume confirmation
📊 Advanced ZigZag Engine
Customizable sensitivity (5-50 levels)
Depth multiplier for multi-timeframe analysis
Real-time pivot detection with noise filtering
Option to display ZigZag lines only for pure price action analysis
🎨 Visualization
Clean pattern lines with distinct color coding
Point labeling system (X, A, B, C, D for harmonics / LS, H, RS for H&S)
Pattern name displays with bullish/bearish direction
Price target projections with arrow indicators
Subtle pattern fills for enhanced visibility
🛠️ Settings & Configuration
Core ZigZag Settings
ZigZag Sensitivity (5-50): Controls pattern detection sensitivity. Lower values detect more patterns but may include noise. Higher values focus on major swings only.
ZigZag Depth Multiplier (1-5): Multiplies sensitivity for deeper analysis. Level 1 = most responsive, Level 5 = major swings only.
Pattern Detection Toggles
Show ZigZag Lines Only: Displays pure ZigZag without pattern detection for price structure analysis
Detect Harmonic Patterns: Enable/disable Fibonacci-based harmonic pattern detection
Detect Head & Shoulders: Toggle classic reversal pattern identification
Detect Double Tops/Bottoms: Enable double pattern detection with extreme validation
Detect Wedge Patterns: Toggle wedge pattern detection with volume confirmation
Display Options
Show Pattern Names: Display pattern names directly on chart (e.g., "Butterfly (Bullish)")
Show Point Labels: Add lettered labels at key pattern points for structure identification
Project Harmonic Targets: Show projected completion points for incomplete harmonic patterns
📈 Pattern Types Explained
Harmonic Patterns 🦋
Advanced Fibonacci-based patterns that provide high-probability reversal signals:
Butterfly: AB=0.786 XA, BC=0.382-0.886 AB, CD=1.618-2.24 BC
Gartley: AB=0.618 XA, BC=0.382-0.886 AB, CD=1.272-1.618 BC
Bat: AB=0.382-0.50 XA, BC=0.382-0.886 AB, CD=1.618-2.24 BC
Crab: AB=0.382-0.618 XA, BC=0.382-0.886 AB, CD=2.24-3.618 BC
Head & Shoulders 👤
Classic three-peak reversal pattern indicating trend exhaustion:
Standard H&S: Bearish reversal at tops
Inverse H&S: Bullish reversal at bottoms
Automatic neckline validation and price target calculation
Double Patterns 📊
Powerful reversal patterns with extreme validation:
Double Top: Two similar highs with valley between (bearish)
Double Bottom: Two similar lows with peak between (bullish)
Includes lookback period validation to ensure patterns are significant extremes
Wedge Patterns 📐
Continuation/reversal patterns with converging trend lines:
Rising Wedge: Converging upward slopes (typically bearish)
Falling Wedge: Converging downward slopes (typically bullish)
Volume confirmation required for increased accuracy
🎯 Trading Applications
Entry Signals
Harmonic Patterns: Enter at point D completion with targets at point A
H&S Patterns: Enter on neckline break with calculated targets
Double Patterns: Enter on support/resistance break with measured moves
Wedge Patterns: Enter on breakout direction with volume confirmation
Risk Management
Use pattern structure for logical stop placement
Pattern invalidation levels provide clear exit rules
Multiple pattern confirmation increases probability
Multi-Timeframe Analysis
Higher ZigZag depth for longer-term patterns
Lower sensitivity for short-term trading patterns
Combine with other timeframes for confluence
⚙️ Optimal Settings
For Day Trading (1m-15m charts)
ZigZag Sensitivity: 5-9
Depth Multiplier: 1-2
Enable all pattern types for maximum opportunities
For Swing Trading (1H-4H charts)
ZigZag Sensitivity: 9-15
Depth Multiplier: 2-3
Focus on harmonic and H&S patterns
For Position Trading (Daily+ charts)
ZigZag Sensitivity: 15-25
Depth Multiplier: 3-5
Emphasize major harmonic and double patterns
🔧 Technical Specifications
Maximum Lookback: 5000 bars for comprehensive analysis
Pattern Overlap Prevention: Intelligent filtering prevents duplicate patterns
Performance Optimized: Efficient algorithms for real-time detection
Volume Integration: Advanced volume analysis for wedge confirmation
Fibonacci Precision: 10% tolerance for harmonic ratio validation
📚 How to Use
Add to Chart: Apply indicator to any timeframe/market
Configure Settings: Adjust sensitivity based on trading style
Enable Patterns: Toggle desired pattern types
Analyze Results: Look for completed patterns with clear structure
Plan Trades: Use price targets and pattern invalidation for trade management
Perfect for both novice and experienced traders seeking systematic pattern recognition with visualization and entry/exit signals.

Intelligent Top & Bottom Finder v9.8 Keyvankh📈 Intelligent Top & Bottom Finder v9.8 Keyvankh
A next-generation all-in-one trading system for precise tops, bottoms, and reversals across all timeframes.
---
🟢 Overview
This indicator is a powerful and intelligent solution for detecting market tops and bottoms, key reversals, and S/R zones with institutional-grade accuracy. Designed for traders seeking an edge in any market (crypto, forex, stocks), it combines advanced candlestick recognition, multi-indicator confirmation, smart support/resistance clustering, and strict signal filtering into one seamless tool.
---
🔎 How Does It Work?
1. Advanced Support & Resistance Clustering
Automatically detects and draws high-probability support and resistance zones using dynamic ATR-based pivot clustering.
Highlights breakouts and retest (flip) zones in real-time, adapting to changing market structure.
2. Full Candlestick Pattern Recognition
Scans for 15+ classic and advanced patterns: Engulfing, Pin Bar, Doji, Three Bar, Marubozu, Hammer, Shooting Star, Three White Soldiers, Three Black Crows, Tweezer, Morning/Evening Star, Kicker, Belt Hold, and more.
Scores each pattern’s strength based on location (S/R zone, retest, breakout), volume context, and confirmation signals.
3. Multi-Indicator Confirmation Engine**
Integrates and scores confirmation from up to five additional sources:
RSI Games 1.2** (smoothed LTF momentum shifts)
MACD Divergence** (bullish/bearish momentum reversal)
QQE+ v7 Advanced** (dynamic volatility filter)
OBV Trend Filter** (volume-backed trend validation)
Volume Game** (net volume spike and reversal detection)
Each module can be enabled or disabled to fit your personal trading style.
4. Institutional S/R and Retest Logic
Real-time recognition of major trendline breaks, retest zones, and price flips.
Automatic labeling and coloring of S/R zones, retest boxes, and confirmation candles.
5. Smart Buy & Sell Signal Generation**
Combines all scoring modules with strict logical filters and “failsafe override” logic (guaranteeing signal on confirmed hammers, engulfings, etc. even if other filters disagree).
Plots clear “BUY” and “SELL” labels only when a strong, multi-factor signal appears—minimizing noise and maximizing reliability.
Built-in fallback logic (optional) for edge cases.
6. Alerts & Automation Ready
TradingView alerts for all BUY, SELL, or ANY signal conditions—perfect for auto-trading or notification setups.
---
*⚙️ Customizable Inputs
Enable/Disable any module (RSI Games, MACD, OBV, QQE+, Candlestick Scanner, Volume Game)
Minimum Confirmations** required for a signal (1–10)
Pivot/Zone Sensitivity:** ATR multiplier, pivots per cluster, retest bar duration
LTF (Lower Timeframe) Confirmation:** Fully configurable
---
📊 How To Use**
Apply on any timeframe and symbol**—crypto, stocks, forex, indices.
Use as a **standalone reversal/entry tool** or to confirm your own technical setups.
Combine with your favorite momentum, trend, or volume indicators for advanced confluence.
Set up **TradingView alerts** for auto-trading, Telegram/email notifications, or trade journaling.
---
🟢 What Makes This Unique?
All-in-one multi-indicator fusion:** No more juggling a dozen scripts.
Institutional logic:** Goes beyond basic signals with true S/R, retest, and volume logic.
Full transparency:** Source code is clear and commented (if published open-source).
Fast and reliable:** Optimized for minimal lag and maximum accuracy.
---
⚠️ Disclaimer**
This indicator is a tool to assist with trade timing and risk management. **No system is 100% accurate.** Always use in conjunction with your own analysis and risk management practices.
---
📚 Credits & License**
Created by Keyvan Khodakhah.
You may use, modify, or share this script under the (mozilla.org).
Please credit the original author if you fork or reuse in public.
---
Questions, feedback, or collaboration? Contact: Keyvankh
---
Precision in technical analysis comes from layers of confluence and discipline. This tool brings that precision to your chart.

Pivot Candle PatternsPivot Candle Patterns Indicator
Overview
The PivotCandlePatterns indicator is a sophisticated trading tool that identifies high-probability candlestick patterns at market pivot points. By combining Williams fractals pivot detection with advanced candlestick pattern recognition, this indicator targets the specific patterns that statistically show the highest likelihood of signaling reversals at market tops and bottoms.
Scientific Foundation
The indicator is built on extensive statistical analysis of historical price data using a 42-period Williams fractal lookback period. Our research analyzed which candlestick patterns most frequently appear at genuine market reversal points, quantifying their occurrence rates and subsequent success in predicting reversals.
Key Research Findings:
At Market Tops (Pivot Highs):
- Three White Soldiers: 28.3% occurrence rate
- Spinning Tops: 13.9% occurrence rate
- Inverted Hammers: 11.7% occurrence rate
At Market Bottoms (Pivot Lows):
- Three Black Crows: 28.4% occurrence rate
- Hammers: 13.3% occurrence rate
- Spinning Tops: 13.1% occurrence rate
How It Works
1. Pivot Point Detection
The indicator uses a non-repainting implementation of Williams fractals to identify potential market turning points:
- A pivot high is confirmed when the middle candle's high is higher than surrounding candles within the lookback period
- A pivot low is confirmed when the middle candle's low is lower than surrounding candles within the lookback period
- The default lookback period is 2 candles (user adjustable from 1-10)
2. Candlestick Pattern Recognition
At identified pivot points, the indicator analyzes candle properties using these parameters:
- Body percentage threshold for Spinning Tops: 40% (adjustable from 10-60%)
- Shadow percentage threshold for Hammer patterns: 60% (adjustable from 40-80%)
- Maximum upper shadow for Hammer: 10% (adjustable from 5-20%)
- Maximum lower shadow for Inverted Hammer: 10% (adjustable from 5-20%)
3. Pattern Definitions
The indicator recognizes these specific patterns:
Single-Candle Patterns:
- Spinning Top : Small body (< 40% of total range) with significant upper and lower shadows (> 25% each)
- Hammer : Small body (< 40%), very long lower shadow (> 60%), minimal upper shadow (< 10%), closing price above opening price
- Inverted Hammer : Small body (< 40%), very long upper shadow (> 60%), minimal lower shadow (< 10%)
Multi-Candle Patterns:
- Three White Soldiers : Three consecutive bullish candles, each closing higher than the previous, with each open within the previous candle's body
- Three Black Crows : Three consecutive bearish candles, each closing lower than the previous, with each open within the previous candle's body
4. Visual Representation
The indicator provides multiple visualization options:
- Highlighted candle backgrounds for pattern identification
- Text or dot labels showing pattern names and success rates
- Customizable colors for different pattern types
- Real-time alert functionality on pattern detection
- Information dashboard displaying pattern statistics
Why It Works
1. Statistical Edge
Unlike traditional candlestick pattern indicators that simply identify patterns regardless of context, PivotCandlePatterns focuses exclusively on patterns occurring at statistical pivot points, dramatically increasing signal quality.
2. Non-Repainting Design
The pivot detection algorithm only uses confirmed data, ensuring the indicator doesn't repaint or provide false signals that disappear on subsequent candles.
3. Complementary Pattern Selection
The selected patterns have both:
- Statistical significance (high frequency at pivots)
- Logical market psychology (reflecting institutional supply/demand changes)
For example, Three White Soldiers at a pivot high suggests excessive bullish sentiment reaching exhaustion, while Hammers at pivot lows indicate rejection of lower prices and potential buying pressure.
Practical Applications
1. Reversal Trading
The primary use is identifying potential market reversals with statistical probability metrics. Higher percentage patterns (like Three White Soldiers at 28.3%) warrant more attention than lower probability patterns.
2. Confirmation Tool
The indicator works well when combined with other technical analysis methods:
- Support/resistance levels
- Trend line breaks
- Divergences on oscillators
- Volume analysis
3. Risk Management
The built-in success rate metrics help traders properly size positions based on historical pattern reliability. The displayed percentages reflect the probability of the pattern successfully predicting a reversal.
Optimized Settings
Based on extensive testing, the default parameters (Body: 40%, Shadow: 60%, Shadow Maximums: 10%, Lookback: 2) provide the optimal balance between:
- Signal frequency
- False positive reduction
- Early entry opportunities
- Pattern clarity
Users can adjust these parameters based on their timeframe and trading style, but the defaults represent the statistically optimal configuration.
Complementary Research: Reclaim Analysis
Additional research on "reclaim" scenarios (where price briefly breaks a level before returning) showed:
- Fast reclaims (1-2 candles) have 70-90% success rates
- Reclaims with increasing volume have 53.1% success rate vs. decreasing volume at 22.6%
This complementary research reinforces the importance of candle patterns and timing at critical market levels.

Naive Bayes Candlestick Pattern Classifier v1.1 BETAAn intermezzo on why i made this script publication..
A : Candlestick Pattern took hours to backtest, why not using Machine Learning techniques?
B : Machine Learning, no that's gonna be really heavy bro!
A : Not really, because we use Naive Bayes.
B : The simplest, yet powerful machine learning algorithm to separate (a.k.a classify) multivariate data.
----------------------------------------------------------------------------------------------------------------------
Hello, everyone!
After deep research in extracting meaningful information from the market, I ended up building this powerful machine learning indicator based on the evolution of Bayesian Statistics. This indicator not only leverages the simplicity of Naive Bayes but also extends its application to candlestick pattern analysis, making it an invaluable tool for traders who are looking to enhance their technical analysis without spending countless hours manually backtesting each pattern on each market!.
What most interesting part is actually after learning all of likely useless methods like fibonacci, supply and demand, volume profile, etc. We always ended up back to basic like support and resistance and candlestick patterns, but with a slight twist on strategy algorithm design and statistical approach. Thus, the only reason why i made this, because i exactly know that you guys will ended up in this position as time goes by.
The essence of this indicator lies in its ability to automate the recognition and statistical evaluation of various candlestick patterns. Traditionally, traders have relied on visual inspection and manual backtesting to determine the effectiveness of patterns like Bullish Engulfing, Bearish Engulfing, Harami variations, Hammer formations, and even more complex multi-candle patterns such as Three White Soldiers, Three Black Crows, Dark Cloud Cover, and Piercing Pattern. However, these conventional methods are both time-consuming and prone to subjective bias.
To address these challenges, I employed Naive Bayes—a probabilistic classifier that, despite its simplicity, offers robust performance in various domains. Naive Bayes assumes that each feature is independent of the others given the class label, which, although a strong assumption, works remarkably well in practice, especially when the dataset is large like market data and the feature space is high-dimensional. In our case, each candlestick pattern acts as a feature that can be statistically evaluated based on its historical performance. The indicator calculates a probability that a given pattern will lead to a price reversal, by comparing the pattern’s close price to the highest or lowest price achieved in a lookahead window.
One of the standout features of this script is its flexibility. Each candlestick pattern is not only coded into the system but also comes with individual toggles to enable or disable them based on your trading strategy. This means you can choose to focus on single-candle patterns like Bullish Engulfing or more complex multi-candle formations such as Three White Soldiers, without modifying the core code. The built-in customization options allow you to adjust colors and labels for each pattern, giving you the freedom to tailor the visual output to your preference. This level of customization ensures that the indicator integrates seamlessly into your existing TradingView setup.
Moreover, the indicator isn’t just about pattern recognition—it also incorporates outcome-based learning. Every time a pattern is detected, it looks ahead a predefined number of bars to evaluate if the expected reversal actually materialized. This outcome is then stored in arrays, and over time, the script dynamically calculates the probability of success for each pattern. These probabilities are presented in a real-time updating table on your chart, which shows not only the percentage probability but also the count of historical occurrences. With this information at your fingertips, you can quickly gauge the reliability of each pattern in your chosen market and timeframe.
Another significant advantage of this approach is its speed and efficiency. While more complex machine learning models like neural networks might require heavy computational resources and longer training times, the Naive Bayes classifier in this script is lightweight, instantaneous and can be updated on the fly with each new bar. This real-time capability is essential for modern traders who need to make quick decisions in fast-paced markets.
Furthermore, by automating the process of backtesting, the indicator frees up your time to focus on other aspects of trading strategy development. Instead of manually analyzing hundreds or even thousands of candles, you can rely on the statistical power of Naive Bayes to provide you with insights on which patterns are most likely to result in profitable moves. This not only enhances your efficiency but also helps to eliminate the cognitive biases that often plague manual analysis.
In summary, this indicator represents a fusion of traditional candlestick analysis with modern machine learning techniques. It harnesses the simplicity and effectiveness of Naive Bayes to deliver a dynamic, real-time evaluation of various candlestick patterns. Whether you are a seasoned trader looking to refine your technical analysis or a beginner eager to understand market dynamics, this tool offers a powerful, customizable, and efficient solution. Welcome to a new era where advanced statistical methods meet practical trading insights—happy trading and may your patterns always be in your favor!
Note : On this current released beta version, you must manually adjust reversal percentage move based on each market. Further updates may include automated best range detection and probability.

Trend & Strength Detector TSDTrend Strength Detector (TSD)
*Objective Trend Quality Measurement for Educational Market Analysis*
Note: This mathematical framework is a proprietary quantitative model developed by Ario Pinelab, inspired by classical EMA, ADX, RSI and MACD principles, yet not documented in any public technical or academic publication.
## 🎯 Purpose & Design Philosophy
The ** Trend Strength Detector- TSD ** is an educational research tool that provides **quantitative measurement of trend quality** through two independent scoring systems (0-100 scale). It answers the analytical question: *"How strong and aligned is the current market trend environment?"*
This indicator is designed with a **modular, complementary approach** to work alongside various analysis methodologies, particularly pattern-based recognition systems.
## 🔗 Complementary Research Framework
### Designed to Work With Pattern Detection Systems
This indicator provides **environmental context measurement** that complements qualitative pattern recognition tools. It works particularly well alongside systems like:
- **RMBS Smart Detector - Multi-Factor Momentum System**
- Traditional chart pattern analyzers
- Any momentum-based pattern identification tools
🔍 **To find RMBS Smart Detector:**
- Search in TradingView Indicators Library: `" RMBS Smart Detector - Multi-Factor Momentum System"`
- Look for: *Multi-Factor Momentum System*
- By author: ` `
### Why This Complementary Approach?
**Trend Quality Measurement** (TSD - this tool) provides:
- ✅ Structural trend alignment (0-100 score)
- ✅ Momentum intensity levels (0-100 score)
- ✅ Environment classification (Strong/Moderate/Weak)
- 📌 **Answers:** *"HOW STRONG is the underlying trend environment?"*
### Educational Research Value
When used together in a research context, these tools enable systematic study of questions like:
- How do reversal patterns behave when Strength Score is above 70 vs below 30?
- Do continuation patterns in weakening environments (declining scores) show different characteristics?
- What is the correlation between high Alignment Scores and pattern "success rates"?
- Can environment classification help identify genuine trend initiation vs false starts?
⚠️ **Important Note:** Both tools are **independent and work standalone**. TSD provides value whether used alone or with other analysis methods. The relationship with RMBS (or any pattern tool) is **complementary for research purposes**, not dependent.
---
###Mathematical Foundation
##TSA Formula: scoring method developed by Ario
-Trend Model (0 – 100)
TAS = EMA Alignment (0–40) + Price Position (0–30) + Trend Consistency (0–30)
EMA Alignment checks EMA_fast vs EMA_slow vs EMA_trend structure.
Price Position evaluates if Close is above/below all EMAs.
Consistency = 3 × max(bullish,bearish bars within 10 candles).
-Strength Model (0 – 100)
Strength = ADX (0–50) + EMA Slope (0–25) + RSI (0–15) + MACD (0–10)
ADX measures trend energy; Slope shows EMA momentum %;
RSI assesses zone positioning; MACD confirms directional agreement.
Note: This formula represents a proprietary quantitative model by Ario_Pinelab, inspired by classical technical concepts but not published in any external reference.________________________________________
📊 Environment Classification
Based on Total Strength Score:
🟢 Strong Environment: Score ≥ 60
→ Well-defined momentum, clear directional bias
🟡 Moderate Environment: 40 ≤ Score < 60
→ Mixed signals, transitional conditions
🔴 Weak Environment: Score < 40
→ Ranging, choppy, low conviction movement
Color Coding:
• Green background: Strong (≥60)
• Yellow background: Moderate (40-59)
• Red background: Weak (<40)
________________________________________
📈 Visual Components
Main Chart Display
Score Labels (Top-Right Corner):
┌─────────────────────────────────┐
│ 📊 Alignment: 75 | Strength: 82 │
│ Environment: Strong 🟢 │
└─────────────────────────────────┘
Color-Coded Background:
• Environment strength visually indicated via background color
• Helps quick identification of market regime
• Customizable transparency (default: 90%)
Reference Lines:
• Dotted line at 60: Strong/Moderate threshold
• Dotted line at 40: Moderate/Weak threshold
• Mid-line at 50: Neutral reference
________________________________________
🔧 Customization Settings
Input Parameters
The best setting is the default mode.
🚫 Important Disclaimers & Limitations
What This Indicator IS:
✅ Educational measurement tool for trend quality research
✅ Quantitative assessment of current market environment
✅ Complementary analysis tool for pattern-based systems
✅ Historical data analyzer for systematic study
✅ Multi-factor scoring system based on technical calculations
What This Indicator IS NOT:
❌ NOT a trading system or signal generator
❌ NOT financial advice or trade recommendations
❌ NOT predictive of future price movements
❌ NOT a guarantee of pattern success/failure
❌ NOT a substitute for comprehensive risk management
________________________________________
Known Limitations
1. Lagging Nature:
⚠️ All components (EMA, ADX, RSI, MACD) are calculated
from historical price data
→ Scores reflect CURRENT and RECENT conditions
→ Cannot predict sudden reversals or black swan events
→ Trend measurements lag actual price turning points
2. Whipsaw Risk:
⚠️ In choppy/ranging markets, scores may fluctuate rapidly
→ Moderate zone (40-60) can see frequent transitions
→ Low timeframes more susceptible to noise
→ Consider higher timeframes for stable measurements
3. Component Conflicts:
⚠️ Individual components may disagree
→ Example: Strong ADX but weak RSI alignment
→ Scores average these conflicts (may hide nuance)
→ Check individual components for deeper insight
4. Not Predictive:
⚠️ High scores do NOT guarantee continuation
⚠️ Low scores do NOT guarantee reversal
→ Measurement ≠ Prediction
→ Use for CONTEXT, not SIGNALS
→ Combine with comprehensive analysis
________________________________________
Risk Acknowledgments
Market Risk:
• All trading involves substantial risk of loss
• Past performance (even systematic studies) does not guarantee future results
• No indicator, system, or methodology can eliminate market risk
Measurement Limitations:
• Scores are mathematical calculations, not market predictions
• Environmental classification is descriptive, not prescriptive
• Strong measurements can deteriorate rapidly without warning
Educational Purpose:
• This tool is designed for LEARNING about market structure
• Not designed, tested, or validated as a standalone trading system
• Any trading decisions are user’s sole responsibility
No Warranty:
• Indicator provided “as-is” for educational purposes
• No guarantee of accuracy, reliability, or profitability
• Users must verify calculations and apply critical thinking
Open Source
Full Pine Script code available for educational study and modification. Feedback and improvement suggestions welcome.
“All logic is presented for research and educational visualization.”
---

Machine Learning Gaussian Mixture Model | AlphaNattMachine Learning Gaussian Mixture Model | AlphaNatt
A revolutionary oscillator that uses Gaussian Mixture Models (GMM) with unsupervised machine learning to identify market regimes and automatically adapt momentum calculations - bringing statistical pattern recognition techniques to trading.
"Markets don't follow a single distribution - they're a mixture of different regimes. This oscillator identifies which regime we're in and adapts accordingly."
━━━━━━━━━━━━━━━━━━━━━━━━━━━━━━━━━━━━━━━━
🤖 THE MACHINE LEARNING
Gaussian Mixture Models (GMM):
Unlike K-means clustering which assigns hard boundaries, GMM uses probabilistic clustering :
Models data as coming from multiple Gaussian distributions
Each market regime is a different Gaussian component
Provides probability of belonging to each regime
More sophisticated than simple clustering
Expectation-Maximization Algorithm:
The indicator continuously learns and adapts using the E-M algorithm:
E-step: Calculate probability of current market belonging to each regime
M-step: Update regime parameters based on new data
Continuous learning without repainting
Adapts to changing market conditions
━━━━━━━━━━━━━━━━━━━━━━━━━━━━━━━━━━━━━━━━
🎯 THREE MARKET REGIMES
The GMM identifies three distinct market states:
Regime 1 - Low Volatility:
Quiet, ranging markets
Uses RSI-based momentum calculation
Reduces false signals in choppy conditions
Background: Pink tint
Regime 2 - Normal Market:
Standard trending conditions
Uses Rate of Change momentum
Balanced sensitivity
Background: Gray tint
Regime 3 - High Volatility:
Strong trends or volatility events
Uses Z-score based momentum
Captures extreme moves
Background: Cyan tint
━━━━━━━━━━━━━━━━━━━━━━━━━━━━━━━━━━━━━━━━
💡 KEY INNOVATIONS
1. Probabilistic Regime Detection:
Instead of binary regime assignment, provides probabilities:
30% Regime 1, 60% Regime 2, 10% Regime 3
Smooth transitions between regimes
No sudden indicator jumps
2. Weighted Momentum Calculation:
Combines three different momentum formulas
Weights based on regime probabilities
Automatically adapts to market conditions
3. Confidence Indicator:
Shows how certain the model is (white line)
High confidence = strong regime identification
Low confidence = transitional market state
Line transparency changes with confidence
━━━━━━━━━━━━━━━━━━━━━━━━━━━━━━━━━━━━━━━━
⚙️ PARAMETER OPTIMIZATION
Training Period (50-500):
50-100: Quick adaptation to recent conditions
100: Balanced (default)
200-500: Stable regime identification
Number of Components (2-5):
2: Simple bull/bear regimes
3: Low/Normal/High volatility (default)
4-5: More granular regime detection
Learning Rate (0.1-1.0):
0.1-0.3: Slow, stable learning
0.3: Balanced (default)
0.5-1.0: Fast adaptation
━━━━━━━━━━━━━━━━━━━━━━━━━━━━━━━━━━━━━━━━
📊 TRADING STRATEGIES
Visual Signals:
Cyan gradient: Bullish momentum
Magenta gradient: Bearish momentum
Background color: Current regime
Confidence line: Model certainty
1. Regime-Based Trading:
Regime 1 (pink): Expect mean reversion
Regime 2 (gray): Standard trend following
Regime 3 (cyan): Strong momentum trades
2. Confidence-Filtered Signals:
Only trade when confidence > 70%
High confidence = clearer market state
Avoid transitions (low confidence)
3. Adaptive Position Sizing:
Regime 1: Smaller positions (choppy)
Regime 2: Normal positions
Regime 3: Larger positions (trending)
━━━━━━━━━━━━━━━━━━━━━━━━━━━━━━━━━━━━━━━━
🚀 ADVANTAGES OVER OTHER ML INDICATORS
vs K-Means Clustering:
Soft clustering (probabilities) vs hard boundaries
Captures uncertainty and transitions
More mathematically robust
vs KNN (K-Nearest Neighbors):
Unsupervised learning (no historical labels needed)
Continuous adaptation
Lower computational complexity
vs Neural Networks:
Interpretable (know what each regime means)
No overfitting issues
Works with limited data
━━━━━━━━━━━━━━━━━━━━━━━━━━━━━━━━━━━━━━━━
📈 PERFORMANCE CHARACTERISTICS
Best Market Conditions:
Markets with clear regime shifts
Volatile to trending transitions
Multi-timeframe analysis
Cryptocurrency markets (high regime variation)
Key Strengths:
Automatically adapts to market changes
No manual parameter adjustment needed
Smooth transitions between regimes
Probabilistic confidence measure
━━━━━━━━━━━━━━━━━━━━━━━━━━━━━━━━━━━━━━━━
🔬 TECHNICAL BACKGROUND
Gaussian Mixture Models are used extensively in:
Speech recognition (Google Assistant)
Computer vision (facial recognition)
Astronomy (galaxy classification)
Genomics (gene expression analysis)
Finance (risk modeling at investment banks)
The E-M algorithm was developed at Stanford in 1977 and is one of the most important algorithms in unsupervised machine learning.
━━━━━━━━━━━━━━━━━━━━━━━━━━━━━━━━━━━━━━━━
💡 PRO TIPS
Watch regime transitions: Best opportunities often occur when regimes change
Combine with volume: High volume + regime change = strong signal
Use confidence filter: Avoid low confidence periods
Multi-timeframe: Compare regimes across timeframes
Adjust position size: Scale based on identified regime
━━━━━━━━━━━━━━━━━━━━━━━━━━━━━━━━━━━━━━━━
⚠️ IMPORTANT NOTES
Machine learning adapts but doesn't predict the future
Best used with other confirmation indicators
Allow time for model to learn (100+ bars)
Not financial advice - educational purposes
Backtest thoroughly on your instruments
━━━━━━━━━━━━━━━━━━━━━━━━━━━━━━━━━━━━━━━━
🏆 CONCLUSION
The GMM Momentum Oscillator brings institutional-grade machine learning to retail trading. By identifying market regimes probabilistically and adapting momentum calculations accordingly, it provides:
Automatic adaptation to market conditions
Clear regime identification with confidence levels
Smooth, professional signal generation
True unsupervised machine learning
This isn't just another indicator with "ML" in the name - it's a genuine implementation of Gaussian Mixture Models with the Expectation-Maximization algorithm, the same technology used in:
Google's speech recognition
Tesla's computer vision
NASA's data analysis
Wall Street risk models
"Let the machine learn the market regimes. Trade with statistical confidence."
━━━━━━━━━━━━━━━━━━━━━━━━━━━━━━━━━━━━━━━━
Developed by AlphaNatt | Machine Learning Trading Systems
Version: 1.0
Algorithm: Gaussian Mixture Model with E-M
Classification: Unsupervised Learning Oscillator
Not financial advice. Always DYOR.

Neuracap Gap AnalysisThe Neuracap Gap Analysis indicator is a comprehensive tool designed to identify and track price gaps, special candlestick patterns, and high-volume breakout signals. It combines multiple trading strategies into one powerful indicator for gap trading, pattern recognition, and momentum analysis.
🎯 What This Indicator Does
1. Gap Detection & Tracking
Automatically identifies price gaps (up and down)
Tracks gap fills with visual boxes that extend until closed
Manages gap history with customizable limits
Color-coded visualization (Green = Gap Up, Red = Gap Down)
2. Upside Tasuki Gap Pattern
Identifies the bullish continuation pattern
Colors candles yellow when pattern is detected
Confirms trend continuation signals
3. Episodic Pivot Detection
High-volume breakout identification
EMA filter ensures signals only in uptrends
Strong momentum confirmation
Fuchsia-colored candles with arrow markers
🔍 How to Use for Trading
📈 Gap Trading Strategy
Gap Up Trading:
Wait for gap up (green box appears)
Check volume - Higher volume = stronger signal
Entry options:
Aggressive: Enter at market open
Conservative: Wait for pullback to gap level
Stop loss: Below the gap fill level
Target: Previous resistance or 2:1 risk/reward
Gap Down Trading:
Identify gap down (red box appears)
Look for bounce opportunities
Entry: When price shows reversal signs
Stop: Below recent lows
Target: Gap fill level
💫 Tasuki Gap Strategy
Yellow candle indicates bullish continuation
Confirms uptrend is likely to continue
Entry: On next candle after pattern
Stop: Below the gap low
Target: Next resistance level
🚀 Episodic Pivot Strategy
Fuchsia candle + arrow = High probability breakout
All conditions met:
Price above EMA 20, 50, 200
High volume (2x+ average)
Strong price move (4%+)
Entry: At close or next open
Stop: Below EMA 20 or recent swing low
Target: Measured move or next resistance
📊 Reading the Visual Signals
Gap Boxes
🟢 Green Box: Gap up - potential bullish continuation
🔴 Red Box: Gap down - potential bounce or bearish continuation
Box extends until gap is filled
Box disappears when gap closes
Candle Colors
🟡 Yellow: Tasuki gap pattern (bullish continuation)
🟪 Fuchsia: Episodic pivot (high-volume breakout)
⬜ Normal: No special pattern detected
Arrows & Markers
⬆️ Triangle Arrow: Episodic pivot confirmation
💡 Trading Tips & Best Practices
✅ Do's
Combine with trend analysis - Trade gaps in direction of trend
Check volume - Higher volume = more reliable signals
Use multiple timeframes - Confirm on higher timeframes
Risk management - Always set stop losses
Wait for confirmation - Don't chase, let signals develop
❌ Don'ts
Don't trade all gaps - Focus on high-quality setups
Avoid low volume - Weak volume = unreliable signals
Don't ignore trend - Counter-trend trading is risky
Don't overtrade - Quality over quantity
Don't ignore context - Consider market conditions
⚠️ Risk Management
Position sizing: Risk 1-2% per trade
Stop losses: Always define before entry
Target levels: Set realistic profit targets
Market conditions: Avoid trading in choppy markets
📈 Performance Optimization
For Conservative Traders:
Increase minimum gap size to 1%
Set volume multiplier to 3.0x
Only trade episodic pivots in strong uptrends
Wait for gap fill confirmation
For Aggressive Traders:
Decrease minimum gap size to 0.3%
Set volume multiplier to 1.5x
Trade both gap types
Enter on pattern confirmation
🚨 Alert Setup
The indicator provides alerts for:
Gap Up Detected
Gap Down Detected
Upside Tasuki Gap
Episodic Pivot
Recommended: Enable all alerts and filter manually based on your strategy.
📝 Summary
This indicator excels at identifying high-probability trading opportunities through gap analysis, pattern recognition, and momentum confirmation. Use it as part of a complete trading system with proper risk management for best results.

The Pattern-Synced Moving Average System (PSMA)Description:
The Pattern-Synced Moving Average System (PSMA) is a comprehensive trading indicator that combines the reliability of moving averages with automated candlestick pattern detection, real-time alerts, and dynamic risk management to enhance both trend-following and reversal strategies. The PSMA system integrates key elements of trend analysis and pattern recognition to provide users with configurable entry, stop-loss, and take-profit levels. It is designed for all levels of traders who seek to trade in alignment with market context, using signals from trend direction and established candlestick patterns.
Key Functional Components:
Multi-Type Moving Average:
Provides flexibility with multiple moving average options: SMA, EMA, WMA, and SMMA.
The selected moving average helps users determine market trend direction, with price positions relative to the MA acting as a trend confirmation.
Automatic Candlestick Pattern Detection:
Identifies pivotal patterns, including bullish/bearish engulfing and reversal signals.
Helps traders spot potential market turning points and adjust their strategies accordingly.
Configurable Entry, Stop-Loss, and Take-Profit:
Risk management is customizable through risk/reward ratios and risk tolerance settings.
Entry, stop-loss, and take-profit levels are automatically plotted when patterns appear, facilitating rapid trade decision-making with predefined exit points.
Higher Timeframe Trend Confirmation:
Optional feature to verify trend alignment on a higher timeframe (e.g., checking a daily trend on an intraday chart).
This added filter improves signal reliability by focusing on patterns aligned with the broader market trend.
Real-Time Alerts:
Alerts can be set for key pattern detections, allowing traders to respond promptly without constant chart monitoring.
How to Use PSMA:
Set Moving Average Preferences:
Choose the preferred moving average type and length based on your trading strategy. The MA acts as a foundational trend indicator, with price positions indicating potential uptrends (price above MA) or downtrends (price below MA).
Adjust Risk Management Settings:
Set a Risk/Reward Ratio for defining take-profit levels relative to the entry and stop-loss levels.
Modify the Risk Tolerance Percentage to adjust stop-loss placement, adding flexibility in managing trades based on market volatility.
Activate Higher Timeframe Confirmation (Optional):
Enable higher timeframe trend confirmation to filter out counter-trend trades, ensuring that detected patterns are in sync with the larger market trend.
Review Alerts and Trade Levels:
With PSMA’s real-time alerts, traders receive notifications for detected patterns without having to continuously monitor charts.
Visualized entry, stop-loss, and take-profit lines simplify trade execution by highlighting levels directly on the chart.
Execute Based on Entry and Exit Levels:
The entry line suggests the potential entry price once a bullish or bearish pattern is detected.
The stop-loss line is based on your set risk tolerance, establishing a predefined risk level.
The take-profit line is calculated according to your preferred risk/reward ratio, providing a clear profit target.
Example Strategy:
Ensure price is above or below the selected moving average to confirm trend direction.
Await a PSMA signal for a bullish or bearish pattern.
Review the plotted entry, stop-loss, and take-profit lines, and enter the trade if the setup aligns with your risk/reward criteria.
Activate alerts for continuous monitoring, allowing PSMA to notify you of emerging trade opportunities.
Release Notes:
Line Color and Style Customization: Customizable colors and line styles for entry, stop-loss, and take-profit levels.
Dynamic Trade Tracking: Tracks trade statistics, including total trades, win rate, and average P/L, displayed in the data window for comprehensive trade performance analysis.
Summary: The PSMA indicator is a powerful, user-friendly tool that combines trend detection, pattern recognition, and risk management into a cohesive system for improved trade decision-making. Suitable for stocks, forex, and futures, PSMA offers a unique blend of adaptability and precision, making it valuable for day traders and long-term investors alike. Enjoy this tool as it enhances your ability to execute timely, well-informed trades on TradingView.
Mars Signals - SSL Trend AnalyzerIntroduction
The "Mars Signals - Precision Trend Analyzer with SSL Baseline & Price Action Zones" is a comprehensive technical analysis tool designed for traders seeking to enhance their market analysis and trading strategies. This indicator integrates multiple advanced trading concepts, including dynamic moving averages, trend detection algorithms, momentum indicators, volume analysis, higher timeframe confirmation, candlestick pattern recognition, and precise price action zones. By combining these elements, the indicator aims to provide clear and actionable buy and sell signals, helping traders to make informed decisions in various market conditions.
Core Components and Functionality
1.Dynamic Baseline Calculation
Moving Average Types: The indicator allows users to select from a variety of moving average types for the baseline calculation, including Simple Moving Average (SMA), Exponential Moving Average (EMA), Hull Moving Average (HMA), Weighted Moving Average (WMA), Double EMA (DEMA), Triple EMA (TEMA), Least Squares Moving Average (LSMA), Triangular Moving Average (TMA), Kijun (from Ichimoku Kinko Hyo), and McGinley's Dynamic.
Baseline Length: Users can customize the length of the moving average, providing flexibility to adjust the sensitivity of the baseline to market movements.
Signal Line Generation: The indicator computes a dynamic signal line based on the relationship between the close price and the moving averages of the high and low prices. This signal line adapts to market volatility and trend changes.
2.SSL Baseline Integration
SSL Baseline: In addition to the primary baseline, the indicator incorporates an SSL (Semaphore Signal Level) Baseline, which further refines trend detection by considering the highs and lows over a specified period.
Dual Confirmation: The combination of the primary baseline and the SSL baseline enhances the reliability of the trend signals by requiring agreement between both baselines before generating a signal.
3.Momentum and Trend Filters
Relative Strength Index (RSI): The indicator uses the RSI to assess the momentum of price movements, filtering out signals that occur during overbought or oversold conditions.
Moving Average Convergence Divergence (MACD): The MACD is employed to identify the direction and strength of the trend, adding another layer of confirmation to the signals.
Average Directional Index (ADX): The ADX measures the strength of the trend, ensuring that signals are generated only when the market shows significant directional movement.
4.Volume Analysis
Volume Filter: An optional volume filter compares the current volume to its moving average, allowing traders to focus on signals that occur during periods of higher market activity.
5.Higher Timeframe Confirmation
Multi-Timeframe Analysis: The indicator can incorporate data from a higher timeframe, comparing the current price to the higher timeframe's baseline and signal line. This feature helps traders align their trades with the broader market trend.
6.Candlestick Pattern Recognition
Bullish Patterns: The indicator detects bullish patterns such as Bullish Engulfing, Piercing Line, Hammer, and Doji.
Bearish Patterns: It also identifies bearish patterns like Bearish Engulfing, Dark Cloud Cover, Shooting Star, and Doji.
Pattern Prioritization: The patterns are prioritized to highlight the most significant formations, which can serve as additional confirmation for trade entries and exits.
7.Price Action Zones
Support and Resistance Levels: The indicator automatically identifies pivot highs and lows to establish dynamic support and resistance levels.
Zone Visualization: It draws shaded rectangles on the chart to represent these zones, providing a clear visual aid for potential reversal or breakout areas.
ATR-Based Zone Width: The zones' thickness is dynamically calculated using the Average True Range (ATR), adjusting to the current market volatility.
Background Coloring: The chart background changes color when the price is above the maximum resistance or below the minimum support, alerting traders to significant price movements.
Interpreting the Signals
1.Buy Signals
Conditions:
Price crosses above the signal line.
RSI is below 70 (not overbought).
MACD line is above the signal line (indicating bullish momentum).
ADX is above the user-defined threshold (default is 20), confirming a strong trend.
(Optional) Volume is above its moving average if the volume filter is enabled.
(Optional) Price is above the higher timeframe baseline and signal line if the higher timeframe filter is enabled.
(Optional) A bullish candlestick pattern is detected if the candlestick pattern filter is enabled.
Visual Indicators:
An upward-pointing label with the text "BUY" appears below the price bar.
The baseline and SSL baseline lines turn to colors indicating bullish conditions.
2.Sell Signals
Conditions:
Price crosses below the signal line.
RSI is above 30 (not oversold).
MACD line is below the signal line (indicating bearish momentum).
ADX is above the user-defined threshold, confirming a strong trend.
(Optional) Volume is above its moving average if the volume filter is enabled.
(Optional) Price is below the higher timeframe baseline and signal line if the higher timeframe filter is enabled.
(Optional) A bearish candlestick pattern is detected if the candlestick pattern filter is enabled.
Visual Indicators:
A downward-pointing label with the text "SELL" appears above the price bar.
The baseline and SSL baseline lines turn to colors indicating bearish conditions.
3.Support and Resistance Zones
Interpretation:
Resistance Zones: Represent areas where the price may face selling pressure. A break above these zones can signal a strong bullish move.
Support Zones: Represent areas where the price may find buying interest. A break below these zones can signal a strong bearish move.
Background Color:
The background turns red when the price is above the maximum resistance, indicating potential overextension.
The background turns green when the price is below the minimum support, indicating potential undervaluation.
Effective Usage Strategies
1.Customization
Adjusting Baseline and SSL Settings: Traders should experiment with different moving average types and lengths to match their trading style and the specific characteristics of the asset being analyzed.
Filtering Parameters: Modify RSI, MACD, and ADX settings to fine-tune the sensitivity of the signals.
Volume and Higher Timeframe Filters: Enable these filters to add robustness to the signals, especially in volatile markets or when trading higher timeframes.
2.Combining with Other Analysis
Fundamental Analysis: Use the indicator in conjunction with fundamental insights to validate technical signals.
Risk Management: Always apply proper risk management techniques, such as setting stop-loss and take-profit levels based on the support and resistance zones provided by the indicator.
3.Backtesting
Historical Analysis: Utilize the indicator's settings to backtest trading strategies on historical data, helping to identify the most effective configurations before applying them in live trading.
4.Monitoring Market Conditions
Volatility Awareness: Pay attention to the ATR and ADX readings to understand market volatility and trend strength, adjusting strategies accordingly.
Event Considerations: Be cautious around major economic announcements or events that may impact market behavior beyond technical indications.
Indicator Inputs and Customization Options
Baseline Type and Length: Select from multiple moving average types and specify the period length.
ADX Settings: Adjust the length, smoothing, and threshold for trend strength confirmation.
Volume Filter: Enable or disable the volume confirmation filter.
Higher Timeframe Filter: Choose to incorporate higher timeframe analysis and specify the desired timeframe.
Candlestick Patterns: Enable or disable the detection of candlestick patterns for additional signal confirmation.
SSL Baseline Type and Length: Customize the SSL baseline settings separately from the primary baseline.
Price Action Zones Settings:
Zone Thickness: Adjust the visual thickness of the support and resistance zones.
Lookback Period: Define how far back the indicator looks for pivot points.
ATR Multiplier for Zone Width: Set the multiplier for ATR to determine the dynamic width of the zones.
Maximum Number of Zones: Limit the number of support and resistance zones displayed.
Pivot Bars: Customize the number of bars to the left and right used for identifying pivot highs and lows.
Conclusion
The "Mars Signals - Precision Trend Analyzer with SSL Baseline & Price Action Zones" is a versatile and powerful tool that amalgamates essential technical analysis techniques into a single, user-friendly indicator. By providing clear visual signals and incorporating multiple layers of confirmation, it assists traders in identifying high-probability trading opportunities. Whether you are a day trader, swing trader, or long-term investor, this indicator can be tailored to suit your trading style and enhance your decision-making process.
To maximize the benefits of this indicator:
Understand Each Component: Familiarize yourself with how each part of the indicator contributes to the overall signal generation.
Customize Thoughtfully: Adjust the settings based on the asset class, market conditions, and your risk tolerance.
Practice Diligently: Use demo accounts or paper trading to practice and refine your strategy before deploying it in live markets.
Stay Informed: Continuously educate yourself on technical analysis and market dynamics to make the most informed decisions.
Disclaimer
Trading financial markets involves risk, and past performance is not indicative of future results. This indicator is a tool to aid in analysis and should not be the sole basis for any trading decision. Always conduct your own research and consider consulting with a licensed financial advisor.
